
Every AI chip has to prove it works before it can be shipped. Advantest, listed on the Prime Market of the Tokyo Stock Exchange under code 6857, builds the test systems that do much of that proving — and the more complex AI semiconductors become, the more testing each one needs.
That one idea explains a remarkable set of numbers. In the six months from April to September 2026, Advantest’s sales rose 60.5% year over year to ¥845.2 billion, and operating income rose 96.5% to ¥456.8 billion — an operating margin of 54.0%. On October 28, 2026, the company also raised its full-year forecast well above its previous guidance.
This analysis walks through what Advantest actually sells, why chip complexity turns into tester demand, how the record profit converts into cash (and where it does not), and the risks that come with a business this cyclical. It is education, not a recommendation.
A note on names and periods before we start: Advantest’s fiscal year ends on March 31. Its English materials call the year ending March 31, 2027 “FY2026.” Below, “the first half” always means April 1 to September 30, 2026, and the company’s full-year forecast is always labeled as a forecast.
The Thesis in One Minute
- Advantest is a test-equipment company, not a chipmaker. Its systems check finished semiconductors for defects and performance before they ship. In SML’s framework for analyzing semiconductor equipment stocks, it sits in the test corner of the equipment map.
- Complexity is the growth engine. Advantest says demand is being driven by rising production volumes of AI-related semiconductors and by their growing complexity — greater testing requirements as devices become more complex. Both SoC testers (for logic chips such as processors and AI accelerators) and memory testers (for DRAM and non-volatile memory) grew in the first half.
- The cash is real, with two footnotes. Operating cash flow was ¥307.0 billion in six months. But pre-tax income includes a ¥54.2 billion non-cash valuation gain on financial instruments, and the company spent ¥119.5 billion building inventory — both explained below.
- Returns are aggressive. The company bought back ¥105.9 billion of its own shares in the half, resolved a further buyback of up to ¥280 billion on October 28, and set an interim dividend of ¥49 per share, under a policy targeting a total return ratio of at least 50% over its three-year plan period.
- The risks are the mirror image of the thesis. Tester demand is a leveraged bet on chipmakers’ capital spending, sales are 99.4% overseas (so the yen matters enormously), and expectations are now set by a forecast that assumes the boom continues.
What a Tester Actually Does
A semiconductor tester (the industry term is automated test equipment, or ATE) connects to a finished chip and runs it through thousands of electrical checks: Does every circuit respond correctly? Does it run at the rated speed? Does the memory hold data without errors? Test results help manufacturers screen out defective devices and classify devices by performance.
Two trends multiply the work a tester must do:
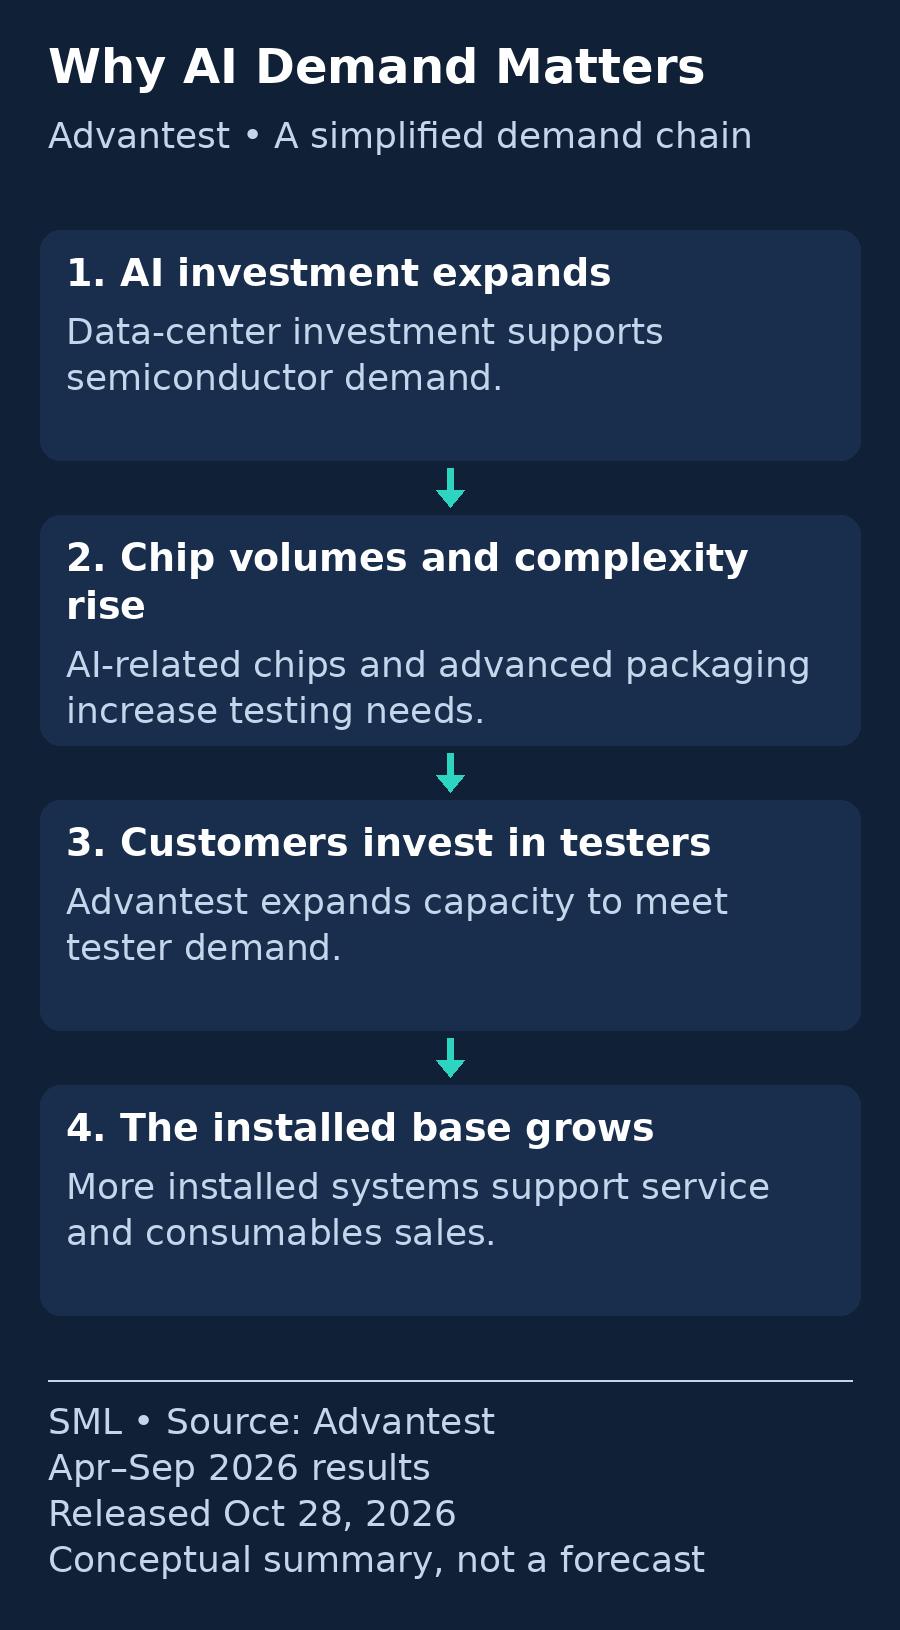
- More chips. Data-center investment is raising production volumes of AI-related semiconductors. This is the same spending wave tracked in SML’s AI capex comparison — except Advantest feels it one step later, when the chips themselves are made and tested.
- Harder chips. Leading AI semiconductors pack in more transistors, stack memory vertically (as in high-bandwidth memory), and combine multiple dies in advanced packages. Advantest’s release attributes tester demand to exactly this: increasing semiconductor complexity, including advanced packaging, raises the volume of testing required per device.
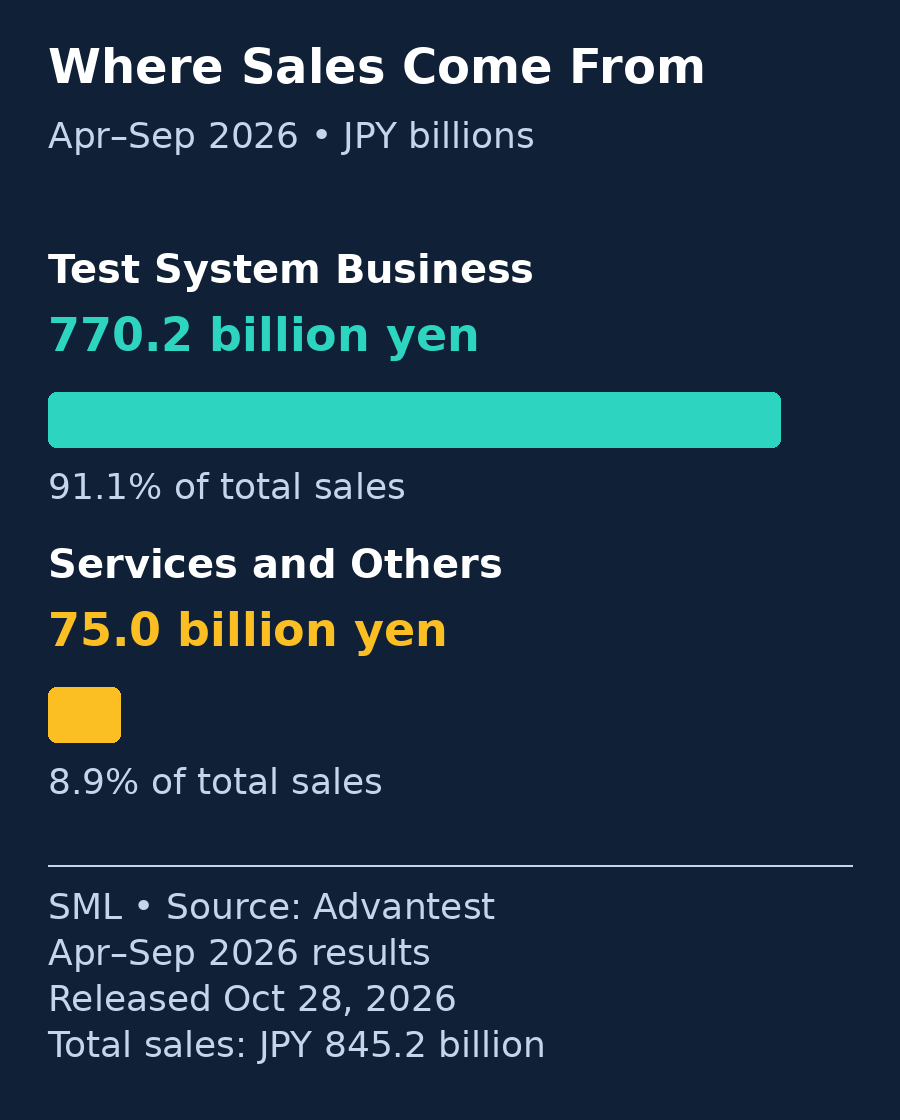
Advantest reports two segments:
- Test System Business — the testers themselves, in three product families: SoC test systems (logic chips), memory test systems (DRAM and non-volatile memory), and other systems (handlers that move chips into the tester, device interfaces and related products).
- Services and Others — maintenance and support for the installed base of testers, plus consumables such as test interface boards. Support demand benefits from a larger installed base, although the segment also includes consumables and other businesses.
For the wider map of the chip supply chain, see SML’s AI Infrastructure Hub and the guide to how to analyze semiconductor stocks.
Latest Results: A Record First Half
Results — six months ended September 30, 2026 (IFRS, consolidated), released October 28, 2026:
| Metric | H1, year ending Mar 2027 | H1, year ended Mar 2026 | Change |
|---|---|---|---|
| Net sales | ¥845.2B | ¥526.7B | +60.5% |
| Gross profit | ¥595.4B | ¥335.3B | +77.6% |
| Operating income | ¥456.8B | ¥232.4B | +96.5% |
| Operating margin | 54.0% | 44.1% | +9.9 pts |
| Income before taxes | ¥510.2B | ¥230.5B | +121.3% |
| Net income (attributable to owners of the parent) | ¥368.1B | ¥169.8B | +116.8% |
| Basic EPS | ¥508.99 | — | — |
| Operating cash flow | ¥307.0B | ¥139.9B | +119.4% |
The company states that sales, operating income, pre-tax income and net income were all record highs for a six-month period.
Two reading notes keep these figures honest:
- Operating income is the cleanest line. Pre-tax income (¥510.2B) is higher than operating income because financial income of ¥57.0B includes a ¥54.2 billion valuation gain on financial instruments the company holds as strategic investments. That gain is non-cash and unrelated to selling testers — it is deducted when reconciling pre-tax income to operating cash flow, as shown below.
- Momentum accelerated within the half. The three months of July–September 2026 alone produced sales of ¥477.7 billion and operating income of ¥266.8 billion (a 55.9% margin), up from ¥367.5 billion and ¥190.0 billion in April–June, per the results presentation. Both quarters were strong; the second was stronger.
Segments — six months ended September 30, 2026 (as reported):
| Segment | Sales | Segment income* | Share of sales |
|---|---|---|---|
| Test System Business | ¥770.2B | ¥455.6B | 91.1% |
| Services and Others | ¥75.0B | ¥20.9B | 8.9% |
| Total (before eliminations) | ¥845.2B | — | 100% |
*Segment income is operating income before share-based compensation expense. Corporate and elimination items of −¥17.0B and share-based compensation of ¥2.6B reconcile the segment total to reported operating income of ¥456.8B.
Inside Test Systems, the release describes growth — without publishing a yen split for the half — on both product fronts: SoC test system sales rose with production volumes and the increasing complexity of AI-related semiconductors, and memory test system sales rose for both DRAM and non-volatile memory amid data-center investment. Inside Services, support sales grew with the installed base, and sales of consumables such as interface boards for high-performance SoCs increased.
Geography underlines the FX exposure: overseas sales were 99.4% of the total. The average exchange rates in the half were ¥160 to the US dollar and ¥185 to the euro, against ¥146 and ¥166 a year earlier — a weaker yen flattered the yen-denominated growth, a point the risks section quantifies.
Forecast — not results. On October 28, 2026, Advantest raised its forecast for the full fiscal year ending March 31, 2027: net sales ¥1,863.0 billion (+65.1% year over year), operating income ¥967.0 billion (a 51.9% margin), net income ¥741.5 billion and basic EPS of ¥1,027.08. The previous forecast, set in July 2026, was sales of ¥1,714.0 billion and operating income of ¥846.0 billion. The implied second half (sales ¥1,017.8B, operating income ¥510.2B at a 50.1% margin) is still a forecast — judge it when the results arrive, not before.
The Growth Engines, in the Company’s Own Framing
1. The tester market itself is expanding. Advantest estimates the calendar-2026 tester market at roughly $13.0–14.5 billion — SoC testers at about $10.5–11.5 billion and memory testers at about $2.5–3.0 billion. The October outlook left these ranges unchanged from July, with SoC testers tracking near the top of their range. Looking into calendar 2027, the company expects end-customer demand to keep exceeding supply across the industry, barring geopolitical or macroeconomic shocks.
2. Capacity is the constraint being attacked. Advantest says annual production capacity for SoC testers has passed 5,000 systems, that it aims to reach its 10,000-system target well ahead of the original schedule, and that memory tester production is being ramped up at a similar pace. Its capital-expenditure plan for the year was raised from ¥50 billion to ¥60 billion (the company’s own capex definition, per the presentation), and first-half R&D spending was ¥44.9 billion.
3. The installed base compounds. A larger installed base can create further demand for support and consumables. Services and Others grew sales 53.7% in the half to ¥75.0 billion — and the company expects support sales to keep growing with the installed base.
Forecast by product — fiscal year ending March 2027 (revised October 28, 2026; July forecast in brackets). Forecasts, not results:
| Product line | FY forecast sales | (July forecast) |
|---|---|---|
| SoC test systems | ¥1,375.0B | (¥1,243.5B) |
| Memory test systems | ¥229.0B | (¥227.0B) |
| Other systems | ¥110.5B | (¥104.5B) |
| Test System Business | ¥1,714.5B | (¥1,575.0B) |
| Services and Others | ¥148.5B | (¥139.0B) |
| Total | ¥1,863.0B | (¥1,714.0B) |
The raise is concentrated in SoC testers — consistent with the company’s explanation that AI-related applications, including ASICs and CPUs, drive the growth. Memory testers were held roughly flat against July, with DRAM back-end testers expected to grow and non-volatile memory testers to increase year over year.
The memory side of the story connects directly to SML’s SK hynix analysis: the same data-center investment that fills memory makers’ order books also increases the volume of memory devices that must be tested. The October 28 interim release and presentation do not attribute this growth to a named customer. This link concerns shared end-demand, not evidence of a disclosed supply relationship with SK hynix.
Cash Flow: Where the Record Profit Does — and Does Not — Turn into Cash
This is the section where Advantest’s statements reward a careful read. (New to cash-flow statements? Start with SML’s free cash flow explainer and come back.)
Six months ended September 30, 2026 (cash-flow statement labels as reported, IFRS):
| Item | ¥ billions |
|---|---|
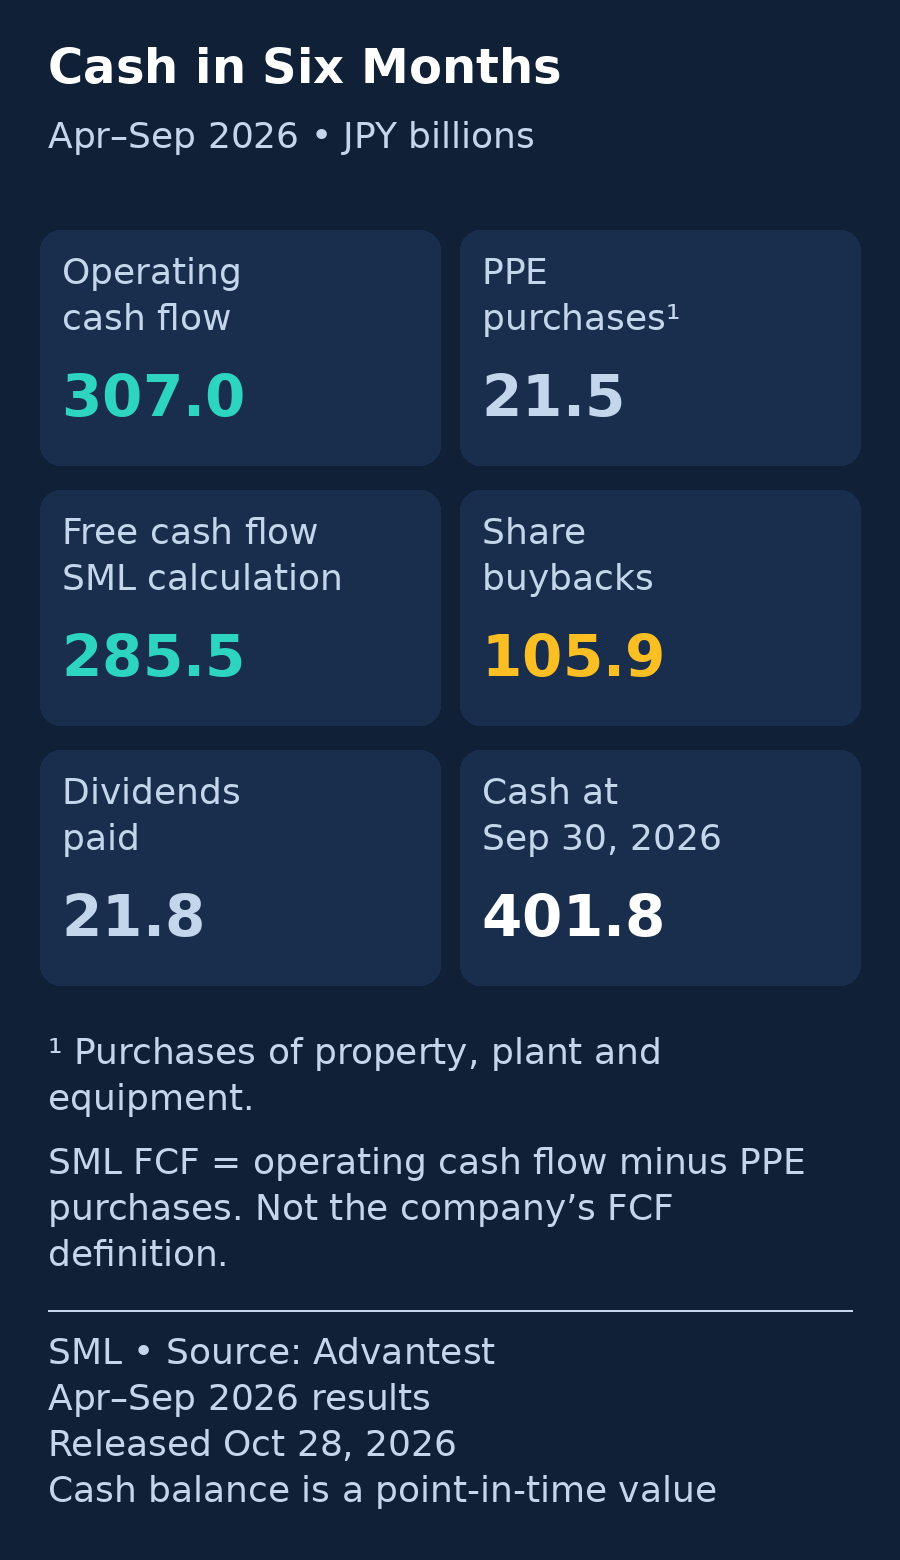
| Net cash provided by operating activities | 307.0 |
| Purchases of property, plant and equipment | (21.5) |
| Purchases of intangible assets | (1.2) |
| Net cash used in investing activities | (210.9) |
| Purchases of treasury shares (buybacks executed) | (105.9) |
| Dividends paid | (21.8) |
| Proceeds from issuance of convertible bonds | +100.0 |
| Cash and cash equivalents, September 30, 2026 | 401.8 |
Three lessons from these lines:
1. Net income and operating cash flow measure different things. Net income was ¥368.1 billion but operating cash flow was ¥307.0 billion. The reconciliation in the release removes the ¥54.2 billion non-cash valuation gain, subtracts a ¥119.5 billion increase in inventories (testers and parts being built ahead of shipments), and reflects ¥109.8 billion of income taxes paid. Profit quality is a question of which profit: operating income of ¥456.8 billion versus operating cash flow affected by inventory movements, taxes paid and other adjustments. Increases in trade and other payables and advances received also supported operating cash flow.
2. “Investing outflow” is not factory spending here. Of the ¥210.9 billion investing outflow, ¥184.4 billion was purchases of debt instruments and ¥26.1 billion purchases of equity instruments — purchases of investment securities, described by management as part of its strategic investments — partly offset by ¥22.1 billion of sales of equity instruments. Actual equipment purchases (property, plant and equipment) were ¥21.5 billion. Reading the investing section line by line, rather than trusting the total, changes the story completely.
3. Definitions decide the FCF number — so here are both. Using the PP&E-only definition applied in this article — operating cash flow minus purchases of property, plant and equipment — free cash flow was ¥285.5 billion for the half (a 33.8% FCF margin on sales). Advantest’s own presentation defines free cash flow differently, as operating plus investing cash flow, which gives ¥96.1 billion — lower because it counts those securities purchases as an outflow. Neither is “wrong”; they answer different questions. SML’s PP&E-only measure excludes purchases of intangible assets and other investing flows, and does not distinguish maintenance from growth spending. The company’s definition measures cash flow after operating and investing activities, before financing and currency translation effects. Both half-year figures here are calculated from the unrounded cash-flow statement amounts; sums of rounded quarterly figures may differ. For the efficiency lens that goes with FCF, see SML’s ROIC guide.
One balance-sheet consequence deserves attention: investment securities rose to ¥432.6 billion at September 30, 2026, up ¥364.7 billion in six months. Management identifies both purchases of investment securities and fair-value changes as drivers of the increase. Equity attributable to owners of the parent was 66.1% of total assets — a strong ratio, but part of that equity cushion is now fair-value gains on financial investments, which can reverse. That is a reason to examine the composition of equity rather than relying on the ratio alone.
Capital Returns: Execution, Authorization and Financing
Advantest’s shareholder-return policy under its current three-year plan (MTP3) targets a cumulative total return ratio — dividends plus buybacks, divided by consolidated net income — of at least 50% over the plan period. The company notes that return targets may be revised in favor of growth investments or if market conditions deteriorate. The first half and the October resolution show the policy in action:
- Buybacks executed: ¥105.9 billion of treasury shares purchased in the six months.
- New buyback resolved October 28, 2026: up to 11 million shares (1.5% of shares outstanding excluding treasury stock), up to ¥280 billion, to be acquired between October 29, 2026 and March 24, 2027.
- Dividend: the interim dividend for the year was set at ¥49 per share, with the company flagging a revision to its dividend forecast; the prior year’s interim and year-end dividends were ¥29 and ¥30 (¥59 in total).
- Funding note: the half’s financing cash flow includes ¥100 billion raised through Euro-yen convertible bonds due 2031. The stated use of proceeds is growth investment—supply capacity, strategic inventory and next-generation testing solutions—not buybacks. Conversion can nevertheless affect future per-share metrics.
Dividends already paid in the half were ¥21.8 billion (the prior year-end dividend). Cash at period end stood at ¥401.8 billion, up from ¥340.0 billion at March 31, 2026.
How the shares trade. According to Advantest’s official IR FAQ, the shares are listed on the Prime Market of the Tokyo Stock Exchange (code 6857, traded in 100-share units). The company was also listed on the New York Stock Exchange in 2001 and voluntarily delisted in 2016; its ADR program continues, and the ADRs trade on the US over-the-counter market under the ticker ATEYY. Broker access, fees and liquidity differ between the Tokyo line and the ADR line — check with your own broker; this article takes no position on which, if either, suits a given reader.
Risks: The Boom Is the Risk
Semiconductor cycle. Testers are capital equipment exposed to changes in customers’ investment plans. Advantest’s own history shows the swing: full-year operating margin was 44.2% in the year ended March 2026 and is forecast at 51.9% this year; a higher forecast margin does not eliminate cyclical risk. The calendar-2027 outlook (“demand exceeds supply”) is a management expectation, explicitly conditioned on no geopolitical or macroeconomic shock. If AI-related capital spending pauses, customers may defer tester purchases.
Customer and end-demand concentration. The October 28 interim release does not provide customer-level sales. The annual securities report does disclose major-customer sales for the previous fiscal year, so annual concentration data should not be mistaken for an H1 breakdown. What is disclosed: 99.4% of sales are overseas, growth is attributed to AI-related semiconductors for data centers, and the forecast raise is concentrated in SoC testers for applications such as ASICs and CPUs. A slowdown at a small number of large chip programs would transmit quickly.
Foreign exchange. With almost all sales overseas, Advantest quantifies the exposure: for the fiscal year ending March 2027, each ¥1 of yen depreciation against the US dollar adds an estimated ¥5.8 billion to operating income, while each ¥1 of depreciation against the euro subtracts ¥0.4 billion. The first half enjoyed averages of ¥160/$ and ¥185/€; the second-half forecast assumes ¥150/$ and ¥170/€. A stronger yen against the dollar is a risk to yen-denominated earnings, other things equal; the euro sensitivity has the opposite sign.
Inventory built ahead of demand. Inventories rose ¥120.7 billion in six months to ¥352.4 billion as the company expands capacity. If end demand disappoints, that inventory — and the capacity behind it — becomes a write-down and fixed-cost risk rather than an asset.
Paper gains in equity and earnings. Financial income included a ¥54.2 billion valuation gain, and investment securities of ¥432.6 billion now sit on the balance sheet. Depending on the financial instruments’ classification, valuation changes can affect profit or loss or other comprehensive income. These changes should be distinguished from operating performance.
Expectations. The revised forecast (basic EPS ¥1,027.08 for the year) roughly doubles the prior year’s EPS of ¥515.15. Any valuation a reader computes from that forecast is only as solid as the forecast itself — and actual results may differ materially from management’s forecast.
Valuation: A Framework, Not a Number
This article gives no price target and uses no live market data. The honest way to frame Advantest’s valuation from primary sources alone:
- The company forecasts basic EPS of ¥1,027.08 for the year ending March 2027, against ¥515.15 actually earned in the year ended March 2026 (both per the results presentation). At the same share price, the price-to-earnings ratio a reader calculates therefore roughly halves or doubles depending on which year’s EPS is used — the first question to ask of any quoted multiple is which period’s earnings.
- Keep earnings and cash-flow definitions distinct: first-half pre-tax income includes non-cash valuation gains, while SML-defined FCF is ¥285.5B for the six-month period. Do not treat a half-year cash figure as a full-year or trailing-twelve-month measure when comparing it with market value.
- If executed, the buyback (up to ¥280B by March 24, 2027) would reduce shares outstanding excluding treasury shares. Conversion of the ¥100B bond, other issuance or treasury-share disposal could offset that effect; check the share count in each quarterly release rather than annualizing blindly.
Reader Checklist: Seven Things to Verify Each Quarter
- Period discipline — is the figure a result, a revised forecast, or the old forecast? Advantest’s “FY2026” ends in March 2027.
- SoC vs memory split — which product line drove the quarter, and is the memory tester recovery (DRAM back-end, non-volatile) keeping pace with SoC?
- Operating income before financial noise — separate valuation gains/losses on financial instruments from tester profit.
- Inventory direction — still building (growth investment) or plateauing (demand signal)?
- The two FCF definitions — SML’s OCF-minus-equipment-purchases vs the company’s OCF-plus-investing; know which one a headline uses.
- Buyback execution vs authorization — how much of the ¥280B program has actually been spent, and what happened to the share count after any convertible-bond conversions?
- FX assumptions — the forecast rests on ¥150/$ for the second half; compare the actual average rate each quarter.
Bottom Line
Advantest’s first half of the fiscal year ending March 2027 is what operating leverage looks like at the sweet spot of a capex cycle: sales up 60.5%, operating income up 96.5%, and ¥285.5 billion of SML-defined free cash flow in six months, alongside ¥105.9 billion of buyback cash outflows and a larger program already authorized. Management describes the growth drivers at the market level: more AI semiconductors, each needing more verification, sold through a market the company expects to stay supply-constrained into calendar 2027.
The same arithmetic runs in reverse. Tester demand is deferrable, 99.4% of sales are to overseas customers and exchange rates affect reported performance, inventories and capacity are being built ahead of the demand they serve, and part of the reported profit and equity is fair-value gains on financial investments. Advantest is a clean way to study how AI spending converts into cash at the equipment layer — provided the reader tracks the cycle, the currency and the definitions, quarter by quarter.
FAQ
Why does Advantest call the year ending March 2027 “FY2026”?
Japanese companies commonly name the fiscal year by the calendar year in which it begins. Advantest’s fiscal year runs April 1 to March 31; the year that began in April 2026 is labeled FY2026 in its English materials and 2026年度 in Japanese. This article spells out “fiscal year ending March 2027” to avoid ambiguity.
Why is pre-tax income higher than operating income?
In the six months to September 2026, financial income of ¥57.0 billion — including a ¥54.2 billion valuation gain on financial instruments held as strategic investments — exceeded financial costs and lifted pre-tax income (¥510.2B) above operating income (¥456.8B). The gain is non-cash: the cash-flow statement subtracts it when reconciling pre-tax income to operating cash flow.
Can US investors buy Advantest shares?
Per the company’s official IR FAQ: Advantest is listed on the Prime Market of the Tokyo Stock Exchange (code 6857); it voluntarily delisted from the New York Stock Exchange in 2016; its ADR program continues and the ADRs (ticker ATEYY) trade on the US over-the-counter market. Availability, costs and liquidity depend on your broker — this article makes no recommendation either way.
What is the difference between an SoC tester and a memory tester?
An SoC (system-on-chip) tester verifies logic devices — processors, AI accelerators, and the mixed-signal chips around them — where each design needs its own test program. A memory tester verifies DRAM and non-volatile memory devices at very high volumes and speeds. Advantest sells both; SoC testers are the larger business (forecast at ¥1,375.0 billion of the ¥1,863.0 billion total for the year ending March 2027) and memory testers the smaller complement (¥229.0 billion forecast).
Why do two different free-cash-flow numbers appear in this article?
Because the definitions differ. In this article, SML computes free cash flow as operating cash flow minus purchases of property, plant and equipment (¥307.0B − ¥21.5B = ¥285.5B for the half). Advantest’s presentation defines it as operating plus investing cash flow (¥96.1B), which treats its ¥184.4 billion of debt-instrument purchases as an outflow. Both are labeled wherever they appear; mixing them would understate or overstate cash generation by nearly ¥190 billion.
Sources
Reported figures are from Advantest’s primary disclosures checked October 29, 2026. Calculated growth rates, margins and FCF figures use those disclosures. Forecasts are the company’s, not ours.
- FY2026 Second Quarter (Semi-Annual) Consolidated Financial Results — English, October 28, 2026. PDF page numbers: results and dividend 1; full-year forecast 2; balance sheet 8–9; profit or loss 10; cash flows 13; segment notes and valuation-gain note 14–15.
- 2027年3月期 第2四半期(中間期)決算短信 — Japanese, October 28, 2026. PDF page numbers: results/dividend 1; forecast 2; balance sheet 6; profit or loss 7; cash flows 9; segment notes 10–11. The headline, segment and cash-flow amounts used here were cross-checked against the English edition.
- Q2 FY26 Financial Briefing — bilingual slides, October 28, 2026. Slide 5: quarterly results; 9: investments and company FCF definition; 12–13: market/capacity outlook; 14: forecasts and FX sensitivity; 15–17: product forecasts; 18: shareholder returns.
- Briefing notes, October 28, 2026, discussion corresponding to slides 9–10: strategic investments and investment-security balances.
- FY2025 Annual Securities Report and Business Report, printed page 130 (PDF page 134): prior-year major-customer disclosure; not an H1 FY2026 breakdown.
- FY2025 Consolidated Financial Results, printed page 14 (PDF page 17): convertible-bond use of proceeds.
- Official IR FAQ: TSE Prime listing, securities code, trading unit, NYSE delisting and OTC ADR status.
This article is for education only and is not investment advice or a recommendation to buy or sell any security. Company forecasts are management’s expectations, not results; figures marked as calculated by Stock Metric Lab use the definitions stated in the text. Verify current prices, share counts and disclosures against the company’s latest filings before making any decision.