
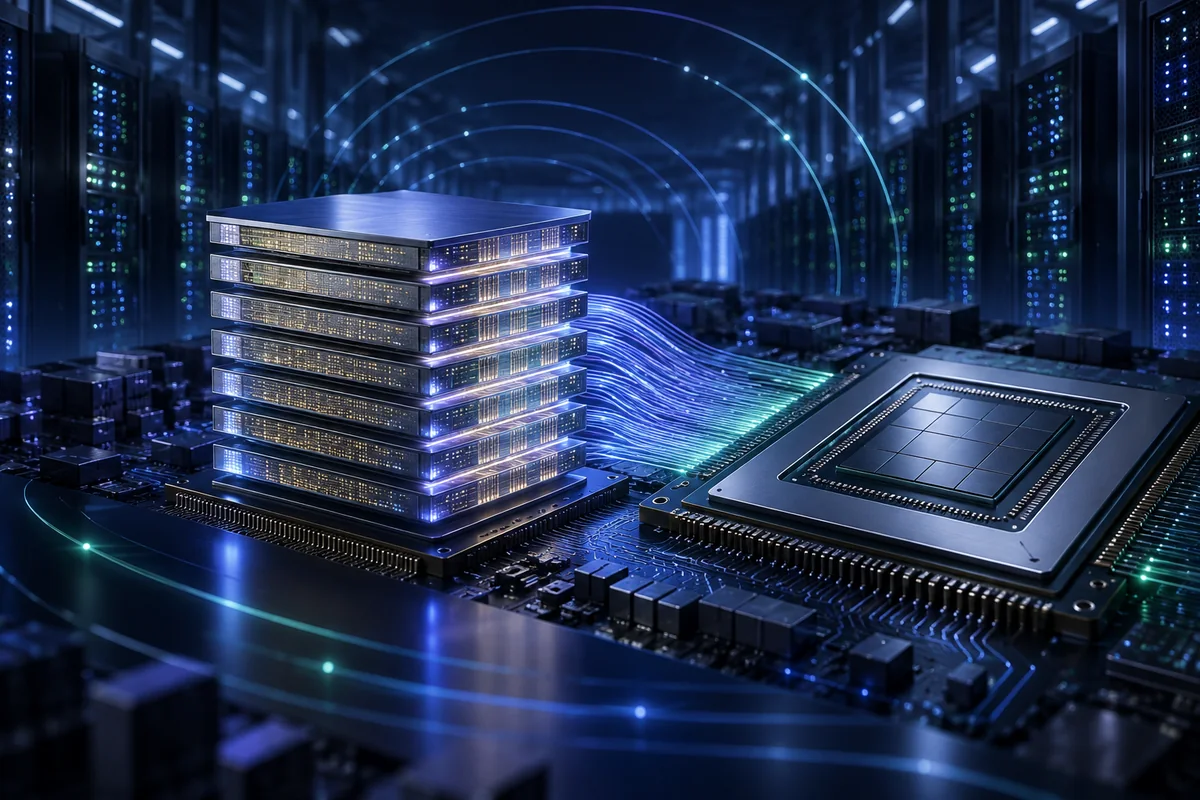
SK hynix became much easier for U.S. investors to access when its American Depositary Shares began trading on Nasdaq in July 2026. The Korean company is a major producer of DRAM, NAND flash, enterprise SSDs, and high-bandwidth memory. It does not design AI accelerators like NVIDIA or AMD. Instead, it manufactures the memory that feeds data to those processors fast enough for expensive computing capacity to be useful.
That distinction frames the investment question: is HBM creating a durable improvement in SK hynix’s through-cycle economics, or are extraordinary current profits still vulnerable to the pricing, capital spending, and inventory cycles that have historically defined memory manufacturing?
This article uses reviewed financial statements through June 30, 2026, company disclosures through August 2026, and U.S. market information through September 11. Popularity and trading activity are research signals, not recommendations.
Editorial review: Source and calculation audit completed September 13, 2026 Data cutoff: September 13, 2026
Key takeaways
- SK hynix is a Korean memory manufacturer. HBM, conventional DRAM, NAND, and enterprise SSDs—not GPUs—drive its economics.
- One Nasdaq-traded
SKHYADS represents 0.1 Korean ordinary share. Ten ADSs represent one ordinary share. - Fiscal 2025 revenue increased 47% to KRW 97.147 trillion and operating profit more than doubled to KRW 47.206 trillion.
- Q2 2026 operating profit reached KRW 60.543 trillion, but net income of KRW 93.923 trillion was inflated by large non-operating financial-asset gains, including Kioxia-related assets. Net income should not be treated as normalized earning power.
- First-half operating cash flow and simple FCF were exceptionally high, but investment dividends and other unusual cash flows complicate normalization. Peak-cycle FCF should not be capitalized mechanically.
- The July U.S. offering issued new Korean ordinary shares behind 177.9 million ADSs. The roughly 2.5% dilution was caused by new share issuance, not merely by wrapping existing shares in ADR form.
- HBM4 shipments, long-term customer agreements, and AI infrastructure demand support the structural case. Expanding supply, large capital requirements, customer concentration, export controls, and the traditional memory cycle support the countercase.
SK hynix explained in 90 seconds
SK hynix is headquartered in South Korea and manufactures memory semiconductors.
DRAM is short-term working memory used by servers, PCs, phones, and other systems. NAND flash retains data without power and is used in storage. Enterprise SSDs package NAND and controllers into storage products for data centers.
HBM, or high-bandwidth memory, stacks multiple DRAM dies vertically and connects them with very wide data paths. It sits close to an accelerator and moves large amounts of data with better bandwidth and energy efficiency than conventional memory arrangements. An AI accelerator can perform calculations extremely quickly, but its computing units sit idle if memory cannot supply data fast enough. HBM helps relieve that bottleneck.
The simplified AI stack looks like this:
- Arm may provide CPU architecture and reusable IP.
- NVIDIA or AMD designs an accelerator and computing platform.
- SK hynix supplies HBM used alongside the accelerator.
- TSMC or another foundry manufactures advanced logic and participates in packaging.
- Cloud platforms install the completed systems in data centers.
SK hynix therefore benefits from AI infrastructure spending without being the company that sells the GPU. It competes most directly with Samsung Electronics and Micron in memory, while also competing across NAND and storage markets.
Why U.S. investor attention increased
The primary catalyst is the new U.S. listing. SKHY began trading on Nasdaq on July 10, 2026, giving U.S. investors a dollar-traded instrument during U.S. market hours. The offering sold 177.9 million ADSs at $149 each and raised approximately $26.5 billion before offering expenses. The shares underlying the ADSs were newly issued rather than sold by an existing shareholder.
On September 11, SKHY traded approximately 14.93 million ADSs at a closing price of $190.07, or about $2.84 billion of single-day dollar volume. English Wikipedia views remained high at 5,231 in the latest seven-day sample versus 5,324 in the previous period, a decline of about 1.7%. The signal is persistent attention rather than accelerating attention.
The business catalyst is HBM. SK hynix began mass shipments of HBM4 during Q2 and said it expected production to ramp in the second half. It also reported long-term agreements with about ten customers and continued investment in manufacturing and advanced packaging.
Why this matters to a U.S. investor
Before the Nasdaq listing, a U.S. investor seeking direct SK hynix exposure generally faced Korean-market access or less convenient instruments. SKHY provides straightforward U.S.-market trading while preserving economic exposure to the Korean issuer.
It also offers a different AI exposure from familiar U.S. names. NVIDIA’s economics depend on accelerator systems and software. Micron is a U.S. memory peer. SK hynix provides direct exposure to HBM, conventional DRAM, NAND, and Solidigm enterprise SSDs, with financial statements reported under K-IFRS in Korean won.
Our AI CapEx comparison explains the spending that can drive demand. The NVIDIA analysis and TSMC analysis help locate SK hynix between compute design, memory, manufacturing, and packaging. The ROIC versus WACC guide is particularly important because a memory producer can report excellent earnings at a cycle peak while destroying value if new capacity earns inadequate returns later.
What exactly does a SKHY investor own?
SKHY is not a separate U.S. operating company. Each Nasdaq-traded ADS is a bank-issued claim on one-tenth of a Seoul-listed SK hynix common share held through Citibank and Korea Securities Depository.
The program is sponsored by SK hynix. Citibank, N.A. is the depositary, and Korea Securities Depository is the Korean custodian. Because one ADS equals 0.1 ordinary share, ten ADSs represent one whole Korean share.
The deposit agreement permits charges of up to $5 per 100 ADSs—equivalent to as much as $0.05 per ADS—for several separate events, including issuance, cancellation, cash distribution, ADS servicing, transfer, and some conversions. Applicable charges can be cumulative. Taxes, registration expenses, transfer costs, and currency-conversion spreads can also apply. These are contractual maximums, not a statement that every fee will be charged every year.
Cash dividends are declared in Korean won. The depositary converts them into U.S. dollars and deducts applicable Korean tax, ADS fees, and conversion costs. The prospectus discusses a general Korean withholding rate and a lower treaty rate for qualifying U.S. beneficial owners, but actual treatment depends on eligibility and documentation. This article does not provide tax advice.
Voting rights are indirect. Investors instruct Citibank, which then attempts to vote the underlying shares. Instructions can normally be given only for ADS quantities representing whole Korean shares—generally multiples of ten ADSs under the current ratio. Timely receipt of voting materials is not guaranteed.
ADSs can be surrendered to receive underlying Korean shares, subject to cancellation fees, taxes, documentation, Korean-market rules, and broker support. Conversion is not a guaranteed instant arbitrage mechanism.
The U.S. offering created real dilution
The U.S. listing did more than repackage existing shares. SK hynix issued 17.79 million new Korean ordinary shares to support 177.9 million ADSs. Compared with 711.1 million ordinary shares outstanding at June 30, 2026, the new issuance increased the share count by approximately 2.5% by simple calculation. An existing holder’s percentage ownership consequently fell by approximately 2.4%, before considering any other share-count changes.
The offering raised $26.507 billion. That cash can strengthen the balance sheet and fund capacity, but per-share analysis must include the additional shares. The 1.78 billion ADS registration ceiling in the Form F-6 is a legal registration capacity, not the number issued in the IPO; it should not be used as outstanding shares.
How SK hynix makes money
Memory economics can be summarized as volume multiplied by price and product mix, less the cost of technology transitions and manufacturing capacity.
SK hynix earns more when it ships more bits, receives higher prices per bit, and sells a greater share of premium products. HBM can improve mix because its bandwidth, stacking, packaging, qualification, and yield requirements create more value than commodity memory. Enterprise SSDs can similarly add value relative to undifferentiated NAND.
The disadvantage is cyclicality. When the industry adds too much supply or end demand weakens, DRAM and NAND prices can fall rapidly. High fixed manufacturing costs then compress margins. Conversely, supply constraints can create exceptional profitability that should not automatically be extrapolated.
HBM may alter the cycle without eliminating it. It consumes more wafer capacity, requires advanced packaging, and is often designed closely with customers. These characteristics can lengthen commitments and limit short-term supply. Over time, however, Samsung, Micron, and other competitors can expand production, customers can pursue multiple suppliers, and new generations can change relative positioning.
Latest results: extraordinary operating performance
Fiscal 2025 results were already records:
| K-IFRS metric | FY2025 | FY2024 | Change |
|---|---|---|---|
| Revenue | KRW 97.147tn | KRW 66.193tn | +47% |
| Operating profit | KRW 47.206tn | KRW 23.467tn | +101% |
| Operating margin | 49% | 35% | +14 pts |
| Net income | KRW 42.948tn | KRW 19.797tn | +117% |
HBM revenue more than doubled in 2025. SK hynix also reported record NAND revenue, helped by enterprise SSD demand later in the year.
Q2 2026 results accelerated further:
| K-IFRS metric | Q2 2026 | Q1 2026 | Q2 2025 |
|---|---|---|---|
| Revenue | KRW 79.319tn | KRW 52.576tn | KRW 22.232tn |
| Operating profit | KRW 60.543tn | KRW 37.610tn | KRW 9.213tn |
| Operating margin | 76% | 72% | 41% |
| Net income | KRW 93.923tn | KRW 40.346tn | KRW 6.996tn |
The reviewed half-year filing supports the reported figures, but the net-income number needs major qualification. Q2 net income exceeded revenue because large non-operating financial-asset valuation and disposal gains—including effects associated with Kioxia-related assets—were recorded. This is not normal memory-manufacturing profit.
Operating profit is more informative than net income for assessing current operations, although even a 76% operating margin may represent unusually favorable pricing and mix. Investors should not use the quarter’s 118% net margin as a sustainable assumption.
Cash flow, capital spending, and normalization
First-half 2026 operating cash flow was KRW 91.743 trillion. Purchases of property, plant, and equipment were KRW 18.329 trillion, producing a simple CFO-minus-capex figure of KRW 73.414 trillion.
That is not a clean measure of underlying operating FCF. Operating cash flow included approximately KRW 13.984 trillion of dividends received from investments. Long-term investment-asset disposals also produced substantial investing cash inflows. A mechanical subtraction that ignores these items can overstate cash generated by selling memory.
Removing the investment dividend from CFO before subtracting capex produces approximately KRW 59.430 trillion, but that is our analytical adjustment—not a company-defined measure—and still may not represent through-cycle cash flow. It should not be called adjusted FCF without this reconciliation.
Capital intensity is the larger lesson. Cash capital expenditure on property and equipment increased from KRW 8.325 trillion in 2023 to KRW 15.946 trillion in 2024 and KRW 27.519 trillion in 2025. The company expected 2026 capex to increase considerably but did not provide a verified numerical full-year forecast in the materials used here.
Investors should normalize FCF across a full memory cycle. The free-cash-flow analysis guide explains why one strong cash-flow year can be misleading, while the FCF Yield Calculator is useful only after replacing headline FCF with a defensible through-cycle estimate.
Balance sheet: three different “cash” numbers
The company’s Q2 announcement described liquidity or cash-like resources of about KRW 88 trillion and debt of KRW 18.6 trillion, producing a stated net-cash position of approximately KRW 69.4 trillion.
The reviewed balance sheet provides the necessary reconciliation. Accounting cash and cash equivalents alone were KRW 26.836 trillion. Adding short-term financial instruments of KRW 22.398 trillion and short-term investment assets of KRW 38.724 trillion produces approximately KRW 87.958 trillion.
Calling the entire amount “cash and cash equivalents” would therefore be imprecise. Investors should examine the composition, liquidity, valuation risk, restrictions, and purpose of each asset class rather than treating every short-term financial asset as bank cash.
Structural HBM growth or a memory-cycle peak?
The structural case rests on four points:
- AI accelerators need more memory bandwidth and capacity.
- HBM consumes meaningful manufacturing and packaging resources.
- Customer qualification and co-development can make supply relationships sticky.
- SK hynix has begun HBM4 mass shipments and signed longer-term agreements with about ten customers.
The cyclical countercase is equally important:
- High margins attract capacity and competitive investment.
- Customers benefit from multiple qualified suppliers.
- Conventional DRAM and NAND remain material to total results.
- Technology transitions can create yield losses, inventory risk, and rapid changes in leadership.
- Current operating margins may reflect scarcity pricing that is unlikely to persist indefinitely.
The right question is not whether HBM demand grows. It is whether SK hynix earns attractive returns on the capital needed to supply that growth after prices, yields, customer concentration, and future competition normalize.
Valuation framework for a Korean-won business and a U.S.-dollar ADS
A defensible valuation should be built in Korean won first:
- Forecast HBM, conventional DRAM, and NAND through-cycle revenue separately.
- Normalize gross and operating margins rather than anchoring on Q2’s 76% operating margin.
- Include fab, packaging, technology-transition, and maintenance capital expenditure.
- Remove non-operating financial gains and investment dividends from core earning power.
- Estimate enterprise and equity value in won.
- Divide by fully diluted Korean ordinary shares.
- Multiply the per-share result by 0.1 for one ADS.
- Convert the result to dollars using a same-date KRW/USD rate.
Using the September 11 ADS close without a synchronized Korean share price and foreign-exchange rate would conceal possible ADS/home-share divergence. For that reason, this analysis deliberately does not publish a target price or current-price reverse DCF. The DCF Calculator can support the enterprise-value model after through-cycle FCF and a dated FX rate are established.
Risks and disconfirming evidence
- Memory pricing can reverse. HBM does not eliminate DRAM and NAND cyclicality.
- Peak margins may invite overvaluation. Current operating performance should not be extrapolated without a supply response.
- Capital spending is large. Poor demand forecasts or low yields can damage ROIC and FCF.
- Customer concentration matters. AI demand and qualification decisions may depend on a limited group of accelerator and cloud customers.
- Competition is strong. Samsung and Micron can gain share or pressure pricing.
- Technology transitions are unforgiving. HBM4E, process-node, packaging, and NAND execution can change competitive position quickly.
- Geopolitics and export controls matter. Korea, China, Taiwan, and U.S. policy affect customers, equipment, and supply chains.
- The ADR has a short trading history. Liquidity, index inclusion, investor positioning, and home-share convergence are still developing.
- Currency changes the U.S. return. A stronger or weaker Korean won affects the ADS even when the local business is unchanged.
- ADS owners have indirect rights. Depositary mechanics, fees, tax documentation, and voting limitations create friction.
- Tax treatment is investor-specific. Korean withholding, treaty eligibility, U.S. foreign-tax-credit rules, and broker documentation can change the after-tax return; readers should consult a qualified tax professional.
- Headline net income is misleading. Financial-asset gains should not be valued like recurring HBM profit.
Evidence against the bull case would include HBM revenue growth accompanied by declining through-cycle margins, rising inventory, weak cash conversion after adjustment, accelerating capex without higher ROIC, lost customer qualifications, or persistent ADS pricing disconnected from the Korean share.
What to monitor next
- HBM revenue, shipments, mix, and customer qualification disclosures.
- DRAM and NAND prices, bit shipments, and inventory.
- Operating margin after excluding non-operating investment gains.
- CFO after investment dividends and working-capital movements.
- Capex, depreciation, yields, and advanced-packaging capacity.
- Through-cycle ROIC compared with WACC.
- HBM4 and HBM4E production ramps.
- Long-term agreements, customer concentration, and renewal economics.
- KRW/USD movements and the ADS-to-home-share premium or discount.
- ADR fees, dividends, depositary notices, and diluted ordinary shares.
Frequently asked questions
Is SKHY an ADR?
SKHY is a Nasdaq-listed American Depositary Share of SK hynix Inc. Each ADS represents 0.1 Korean ordinary share and is administered by Citibank under the deposit agreement.
What is HBM?
High-bandwidth memory stacks DRAM dies and places high-capacity, high-speed memory close to processors. It helps prevent memory bandwidth from limiting AI accelerator performance.
Is SK hynix a GPU company?
No. SK hynix manufactures memory and storage products. Its HBM is used alongside accelerators designed by companies such as NVIDIA and AMD.
How is SK hynix different from Micron?
Both manufacture memory, but Micron is a U.S. corporation with U.S. common stock, while SK hynix is a Korean K-IFRS issuer accessed in the U.S. through ADSs. Product mix, customer exposure, capacity, and HBM execution also differ.
Does one SKHY ADS equal one Korean share?
No. One ADS represents one-tenth of one Korean ordinary share. Ten ADSs represent one whole Korean share under the current ratio.
Primary sources and methodology
- Reviewed H1 2026 financial statements filed on Form 6-K.
- SK hynix Q2 2026 results, July 29, 2026.
- SK hynix fiscal 2025 results, January 28, 2026.
- SK hynix Nasdaq ADR listing announcement, July 10, 2026.
- SK hynix deposit agreement.
- Final U.S. offering prospectus.
- Wikimedia Pageviews API and U.S. market-data observation through September 11, 2026.
- Nasdaq market activity for SKHY, used for the September 11, 2026 closing-price and volume reference. If publication occurs after the stated data cutoff, refresh the figures first.
Figures are presented in Korean won unless explicitly identified as U.S. dollars. Simple dilution, dollar volume, adjusted cash flow, and ratio calculations are Stock Metric Lab calculations from cited figures. Market prices and tax rules can change; readers should verify them as of their decision date.
*This article is for educational and informational purposes only. It is not investment, financial, tax, legal, or accounting advice, and it is not a recommendation to buy, sell, or hold any security. Verify current filings, ADR terms, tax rules, foreign-exchange rates, and market information before making an investment decision.*