
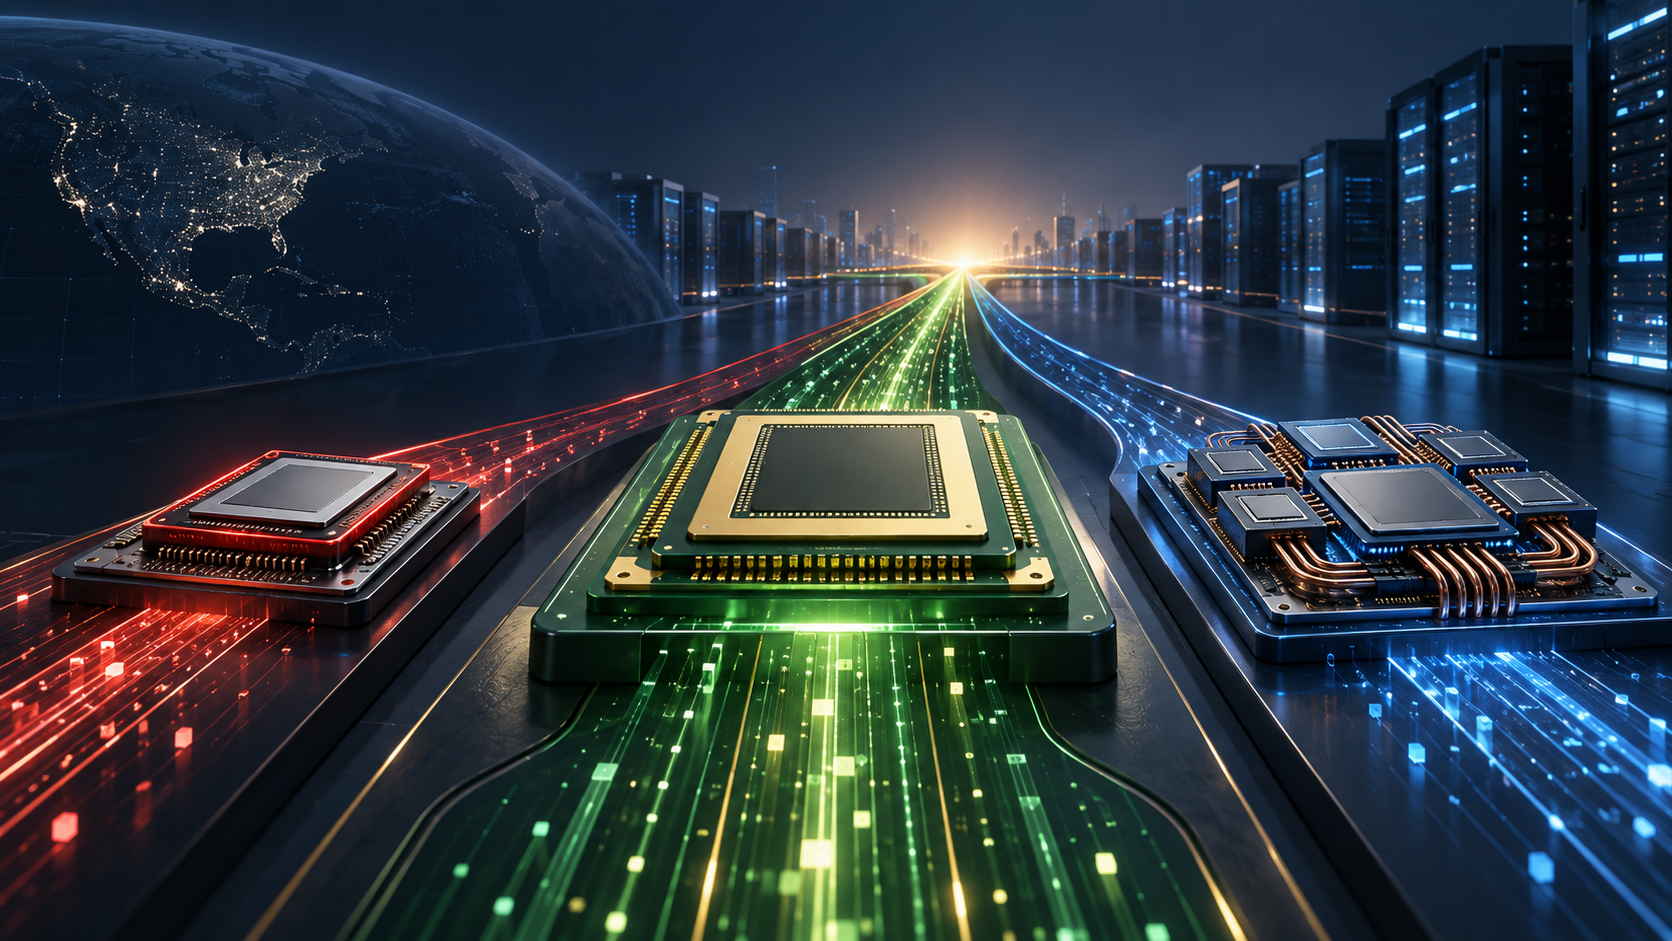
NVIDIA, AMD, and Broadcom all benefit from artificial-intelligence infrastructure spending, but they do not sell the same economic exposure. NVIDIA supplies a broad accelerated-computing platform. AMD competes with merchant CPUs and accelerators. Broadcom combines custom AI silicon and networking with a large infrastructure-software business. The useful question is therefore not simply which company has the fastest AI growth. It is which model can convert demand into durable free cash flow and returns on capital—and what growth an investor must pay for.
This comparison uses each company’s latest reported results available on September 13, 2026. Fiscal periods differ, so the tables retain company-reported dates and do not pretend that every figure is perfectly synchronized.
Reviewed by: Stock Metric Lab (source and calculation review) Data cutoff: September 13, 2026
Key takeaways
- NVIDIA currently has the strongest operating economics: Q2 FY2027 revenue rose 106% year over year, GAAP gross margin was 75.0%, and GAAP operating margin was about 66%. Its scale, software ecosystem, and systems breadth remain the standard competitors must displace.
- AMD offers the clearest merchant-accelerator challenger case: Q2 2026 Data Center revenue rose 107%, but consolidated GAAP operating margin was 17% and first-half FCF margin was about 19%. The investment case depends on closing part of a very large profitability gap without excessive dilution.
- Broadcom offers a different route to AI spending: Q3 FY2026 AI semiconductor revenue reached $16.7 billion while custom accelerators, networking, and infrastructure software produced a 46% quarterly FCF margin. Its VMware-related intangibles and debt make simple earnings and ROIC comparisons less clean.
- There is no price-independent “best stock.” NVIDIA has the strongest reported business economics, AMD has more operating-improvement optionality, and Broadcom has the broadest mix. Valuation must test the expectations embedded in the current price rather than award the highest-quality business automatically.
Quick comparison
| Dimension | NVIDIA (NVDA) | AMD (AMD) | Broadcom (AVGO) |
|---|---|---|---|
| Primary AI exposure | Merchant GPUs, systems, networking, CUDA software ecosystem | EPYC CPUs, Instinct accelerators, ROCm and adaptive computing | Custom AI accelerators, networking and connectivity |
| Additional exposure | Gaming, visualization and edge computing | Client PCs, gaming and embedded | VMware and other infrastructure software |
| Latest reported quarter | Q2 FY2027, ended July 26, 2026 | Q2 2026, ended June 27, 2026 | Q3 FY2026, ended August 2, 2026 |
| Revenue | $96.221bn | $11.536bn | $29.591bn |
| Year-over-year revenue growth | 106% | 50% | 86% |
| GAAP gross margin | 75.0% | 54% | 69.1% calculated |
| GAAP operating margin | 66.2% calculated | 17% | 53.9% calculated |
| Latest AI/data-center signal | Data Center revenue $89.0bn, +117% | Data Center revenue $6.718bn, +107% | AI semiconductor revenue $16.7bn, +221% |
| Cash-flow snapshot | H1 operating cash flow less purchases of property, equipment and intangibles: $70.0bn | H1 operating cash flow less CapEx: $4.124bn | Q3 company-defined FCF: $13.665bn |
| Central risk | Customer concentration, export controls, supply commitments and expectations | Ecosystem gap, scale, margin conversion and dilution | Customer concentration, custom-chip program timing, acquisition accounting and leverage |
The calculated margins divide reported GAAP gross profit or operating income by revenue. NVIDIA’s first-half cash-flow measure is $74.421 billion of operating cash flow less $4.434 billion of purchases related to property, equipment, and intangible assets. AMD’s first-half measure is $5.321 billion of continuing-operations operating cash flow less $1.197 billion of capital expenditure. Broadcom explicitly defines quarterly FCF as $14.197 billion of operating cash flow less $532 million of capital expenditure. These periods and definitions differ; the figures compare cash-generation structure, not identical measurement windows.
The search question hides three different businesses
A search for “NVIDIA vs AMD vs Broadcom stock” sounds like a product contest, but each company occupies a different part of the AI system.
NVIDIA’s advantage is integration. Its economics extend beyond a GPU into systems, networking, libraries, developer tools, and deployment expertise. That can reduce customers’ time to working compute and supports pricing power. Q2 FY2027 Data Center revenue of $89.0 billion represented roughly 92% of total revenue.
AMD is the closest of the three to a conventional merchant-compute challenger. EPYC CPUs, Instinct accelerators, and ROCm give customers an alternative supplier and architecture. AMD also has meaningful client and embedded franchises, but they dilute the purity of its AI exposure and can introduce separate cycles. In Q2 2026, Data Center supplied 58% of revenue.
Broadcom is not trying to duplicate NVIDIA’s model. It helps large customers design custom accelerators and supplies networking that connects AI clusters. Infrastructure software supplied 30% of Q3 revenue, adding recurring economics but also making AVGO a less pure semiconductor comparison. This distinction matters: a custom chip can win when a hyperscaler wants workload-specific cost or control, while a merchant platform can win when flexibility, availability, and software compatibility matter more.
Latest results: growth is strong, but its quality differs
NVIDIA reported Q2 FY2027 revenue of $96.221 billion, up 106% year over year. GAAP operating income was $63.734 billion and gross margin was 75.0%. Data Center revenue rose 117% to $89.0 billion. Management guided Q3 revenue to $108.0 billion, plus or minus 2%, while assuming no Data Center compute revenue from China in that outlook.
There are two cautions behind those exceptional figures. First, the prior-year first half included a $4.5 billion H20-related inventory and purchase-obligation charge, which makes some margin comparisons easier. Second, first-half net income included large gains from equity securities. Those gains do not explain operating income, but they make net income and operating cash flow less interchangeable than the headline figures suggest.
AMD reported Q2 2026 revenue of $11.536 billion, up 50%, and GAAP operating income of $1.990 billion. Data Center revenue rose 107% to $6.718 billion. The comparison period included an $800 million export-control inventory and related charge, so the 14-point improvement in GAAP gross margin to 54% was not solely current operating leverage. AMD guided Q3 revenue to approximately $13.0 billion, plus or minus $300 million.
Broadcom reported Q3 FY2026 revenue of $29.591 billion, up 86%, and GAAP operating income of $15.955 billion. Semiconductor solutions supplied $20.839 billion, or 70% of revenue; infrastructure software supplied $8.752 billion. Management said AI semiconductor revenue was $16.7 billion, up 221%, and guided it to $21.7 billion in Q4. Investors should treat that forward figure as management guidance, not reported revenue.
Free cash flow: follow the conversion, not the label
| Company | Cash-flow period | Operating cash flow | CapEx or disclosed asset purchases | Simple FCF | FCF margin |
|---|---|---|---|---|---|
| NVIDIA | Six months ended July 26, 2026 | $74.421bn | $4.434bn | $69.987bn | 39.4% |
| AMD | Six months ended June 27, 2026 | $5.321bn | $1.197bn | $4.124bn | 18.9% |
| Broadcom | Quarter ended August 2, 2026 | $14.197bn | $0.532bn | $13.665bn | 46.2% |
The margins use revenue from the same disclosed period: $177.837 billion for NVIDIA, $21.789 billion for AMD, and $29.591 billion for Broadcom. They are Stock Metric Lab calculations from filings, not standardized company guidance.
Broadcom leads this snapshot on FCF margin, but the result should not be read as a permanent ranking. Its software mix, acquisition-related intangible amortization, interest payments, and working capital differ from the chip designers. NVIDIA’s first-half operating cash flow was reduced by a $24.590 billion increase in accounts receivable and a $10.204 billion inventory increase, while it also benefited from adding back non-cash items. AMD’s rapid expansion likewise makes working-capital timing important.
For each company, normalize cash flow over several periods and treat stock-based compensation as an economic cost even when it is added back in the cash-flow statement. Use the free-cash-flow analysis guide before entering a number in the FCF Yield Calculator.
ROIC: NVIDIA leads directionally, but one formula is not enough
Return on invested capital is useful only when numerator and denominator describe the same economics. A mechanical screen can mislead for all three companies.
| Company | Why reported returns can look strong or weak | Better analytical adjustment |
|---|---|---|
| NVIDIA | Very high operating profit sits against an asset-light historical capital base; growing securities and strategic investments can distort capital and below-operating-line income | Separate operating assets from excess and strategic investments; normalize taxes and inventory charges; consider capitalized R&D |
| AMD | Heavy current R&D is expensed even though products can generate multiyear benefits; acquisitions added goodwill and intangibles | Compare reported and R&D-capitalized ROIC; include acquired capital consistently; test per-share returns after dilution |
| Broadcom | VMware created large goodwill and acquired intangibles; amortization depresses GAAP profit while excluding acquisition capital inflates adjusted returns | Show both GAAP and cash-operating cases, retain acquisition capital, and include debt-funded capital |
NVIDIA’s 66% quarterly GAAP operating margin and strong cash conversion make it the directional leader in current operating returns. Broadcom’s 54% GAAP operating margin and 46% FCF margin also indicate powerful economics, though acquisition accounting complicates comparison. AMD’s 17% GAAP operating margin shows the most room for improvement, but “room” is not evidence that improvement will occur.
The decision test is whether normalized after-tax operating profit earns more than the cost of the capital—including accumulated R&D, acquisitions, working capital, and dilution—needed to produce it. Our ROIC versus WACC guide explains the framework.
Valuation: separate the best business from the best-priced security
This article deliberately does not freeze a live share-price ranking into the operating comparison. Prices change continuously, while the reporting periods already differ. A defensible valuation should update market capitalization, debt, cash, diluted shares, and normalized FCF on the same date.
Use three layers instead of one multiple:
- Near-term bridge: Start with the latest revenue guidance, segment mix, GAAP margin, working capital, stock compensation, and diluted shares.
- Competitive fade: Model what happens if NVIDIA’s margin premium narrows, AMD gains share but spends more on software and systems, or Broadcom’s custom programs concentrate around a few customers.
- Terminal economics: Fade growth toward a mature rate and require ROIC to converge toward a defensible long-run level rather than extending current AI growth indefinitely.
For a comparable reverse DCF, use normalized FCFF—not company-defined FCF without reconciliation—and one consistent WACC framework. Enter each company’s dated enterprise value and diluted shares in the Reverse DCF Calculator. Then test the implied growth and margin path in the DCF Calculator. A lower implied growth rate is not automatically cheaper if the starting cash flow is temporarily elevated or debt and dilution are understated.
Who appears strongest under different investor questions?
| Investor question | Current evidence points to | Why | What could reverse it |
|---|---|---|---|
| Strongest platform and margins | NVIDIA | Largest AI compute scale, broad system stack, 75% gross margin and 66% operating margin | Faster custom-silicon adoption, software portability, export limits or a severe supply correction |
| Greatest operating-improvement optionality | AMD | Rapid Data Center growth from a smaller base and a wide margin gap | ROCm adoption stalls, deployments fail to scale, or dilution absorbs value creation |
| Best mix of custom silicon, networking and software | Broadcom | AI semiconductor growth plus high-margin infrastructure software and strong FCF | Customer concentration, program delays, integration issues or debt constrains flexibility |
| Lowest-risk stock today | Cannot be answered without a dated valuation | Business quality and security price are separate inputs | A synchronized market-data and reverse-DCF update can establish the required expectations |
The strongest business evidence currently favors NVIDIA. That is an operating conclusion, not a recommendation. AMD may deliver the largest percentage improvement if its accelerator ecosystem and margins scale. Broadcom may offer the broadest cash-flow mix, but investors accepting that diversification also accept acquisition and balance-sheet complexity.
Risks and the strongest counterarguments
NVIDIA
- A few direct and indirect customers account for substantial demand, increasing bargaining and forecast risk.
- Export controls can remove markets, trigger redesigns, or create inventory and purchase-obligation charges.
- Rapid platform transitions require supply commitments across foundry, packaging, memory, networking, and systems.
- The strongest counterargument to caution is that a broad installed base and software ecosystem can reinforce demand: more developers and deployed systems can make displacement harder even when competing silicon is cheaper.
AMD
- Competing hardware is not sufficient if software, networking, systems availability, and developer support lag.
- Customer warrants and stock-based compensation can make per-share value grow more slowly than revenue or enterprise value.
- AMD depends on external manufacturing and advanced packaging, while serving several cyclical end markets.
- The strongest counterargument is that customers want a credible second source. Even a modest share of a rapidly expanding market could materially improve AMD’s revenue and margins from today’s smaller base.
Broadcom
- Custom accelerator programs can be large but concentrated; losing or delaying one program can matter disproportionately.
- VMware adds recurring software economics but also integration, goodwill, intangible-amortization, and leverage complexity.
- Custom chips optimized for known workloads may be less flexible if models or architectures change quickly.
- The strongest counterargument is that hyperscalers can value workload-specific performance, power efficiency, and control enough to move meaningful volume toward custom designs, while Broadcom also earns from networking the cluster.
Risks shared by all three
- AI capital spending could outrun economically useful demand.
- Foundry, advanced packaging, HBM, power, and data-center constraints can delay recognized revenue.
- New architectures or more efficient models can alter compute requirements.
- Reported AI categories are not standardized across companies; management labels should not be treated as perfectly comparable segments.
What evidence would change the ranking?
NVIDIA’s lead would weaken if Data Center growth decelerated sharply while receivables, inventory, purchase commitments, or gross-margin pressure rose. AMD’s position would strengthen if Instinct growth translated into sustained consolidated GAAP margin expansion, normalized FCF per diluted share, and broader software adoption. Broadcom’s case would strengthen if multiple custom programs scaled without increasing customer concentration and if debt declined while software retention remained strong.
The demand side matters too. Our 2026 AI CapEx comparison examines whether hyperscaler spending is producing cloud and advertising growth. Supplier revenue can remain strong temporarily even if customers’ eventual returns disappoint, so an investor should monitor both sides of the capital cycle.
What to monitor next
- NVIDIA Data Center growth, gross margin, receivables, inventory, supply commitments, China exposure, and diluted shares.
- AMD Instinct and EPYC growth, consolidated GAAP margin, ROCm adoption, operating cash flow, and warrant dilution.
- Broadcom AI semiconductor revenue, number and concentration of custom programs, networking mix, VMware performance, debt, and interest expense.
- For all three, normalized FCF per diluted share and incremental ROIC rather than revenue alone.
For deeper company context, read the NVIDIA stock analysis, AMD stock analysis, and Broadcom stock analysis. Browse the Stock Metric Lab Research Hub for related comparisons.
Frequently asked questions
Is NVIDIA better than AMD for AI?
NVIDIA currently reports far greater Data Center scale and much higher consolidated margins, while its software and systems ecosystem broadens the product advantage. AMD is growing rapidly from a smaller base and can benefit from customers seeking an alternative. “Better technology” and “better-priced stock” are not interchangeable conclusions.
Is Broadcom a direct competitor to NVIDIA?
Only partly. Broadcom’s custom accelerators and networking compete for portions of AI infrastructure spending, but its model differs from NVIDIA’s broadly available merchant platform. Broadcom also derives substantial revenue from infrastructure software.
Which company has the best free cash flow?
Broadcom had the highest FCF margin in the latest disclosed snapshot, NVIDIA generated the largest absolute simple FCF, and AMD had the lowest margin. The periods and definitions differ, so investors should normalize each company over multiple quarters before applying a valuation.
Which is the best AI chip stock?
No answer is valid without price and required expectations. NVIDIA currently leads on reported operating economics; AMD offers more margin and share-gain optionality; Broadcom offers custom-silicon, networking, and software diversification. A dated reverse DCF is the appropriate next step.
Primary sources and methodology
- NVIDIA, Q2 fiscal 2027 earnings release, August 26, 2026.
- NVIDIA, Form 10-Q for the quarter ended July 26, 2026, filed August 26, 2026.
- AMD, Q2 2026 earnings release, August 4, 2026.
- AMD, Form 10-Q for the quarter ended June 27, 2026, filed August 4, 2026.
- Broadcom, Q3 fiscal 2026 earnings release, September 2, 2026.
- Broadcom, SEC-filed Q3 fiscal 2026 earnings exhibit, September 2, 2026.
Reported figures retain each company’s fiscal calendar and definitions. Calculated margins and simple FCF figures are Stock Metric Lab calculations using the disclosed numbers described under each table. Guidance is labeled as guidance. This article does not use popularity, management forecasts, or product announcements as a buy signal.
*This article is for educational and informational purposes only. It is not investment, financial, tax, legal, or accounting advice, and it is not a recommendation to buy, sell, or hold NVIDIA, AMD, Broadcom, or any other security. Company disclosures, market prices, regulations, and estimates can change. Verify current filings and market information and consider your objectives and risk tolerance before making an investment decision.*