
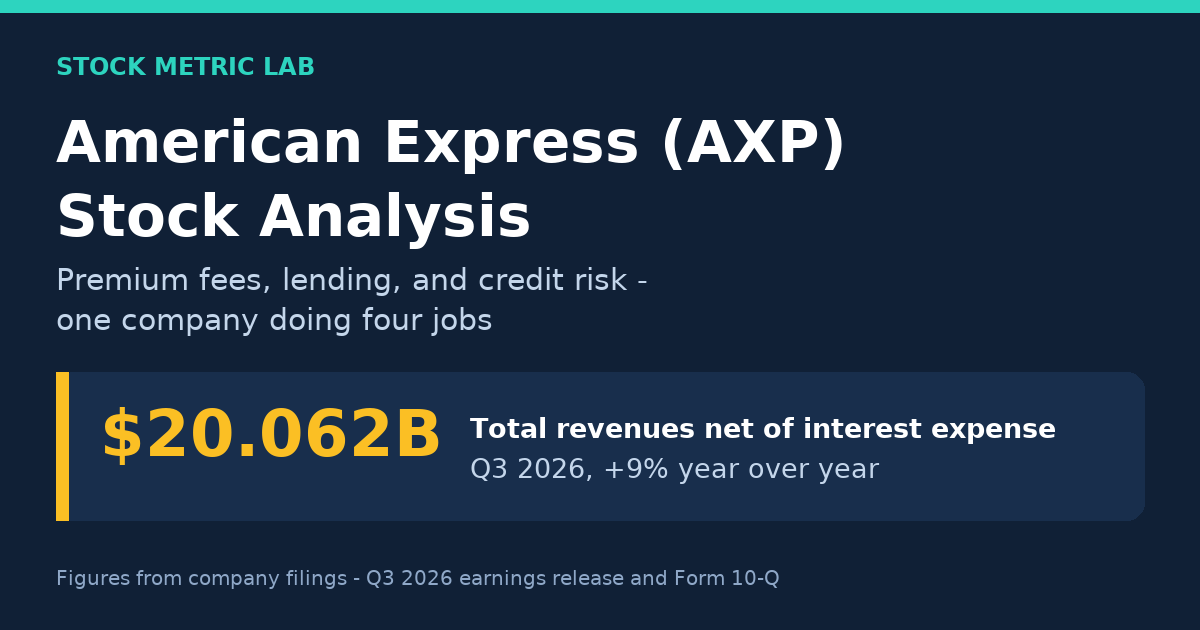
American Express Company (NYSE: AXP) looks, at first glance, like a bigger version of Visa or Mastercard: a card in the wallet, a network behind it, a fee on every swipe. That first glance is misleading. Visa and Mastercard run the rails and leave the lending to banks. American Express runs the rails and issues the cards and lends the money and takes the deposits. It earns more from each dollar of spending than the networks do — and it directly bears cardholder lending losses that the networks generally leave with issuers. The networks still face settlement-guarantee, operational, legal and regulatory risks. The comparison is about the dominant business models, including the partner exceptions described below. This analysis explains how that model shows up in the financial statements, using the company’s own filings, and why its cash flow statement cannot be read the way you read Visa’s.
American Express investment thesis in one minute
- Four jobs in one company: network, merchant acquirer, card issuer, and lender/deposit-taker. Each job adds a revenue line — and the lending job adds credit risk.
- Attractive economics: premium card fees are the fastest-growing revenue line, and card members who revolve balances add a large interest-income stream on top of merchant fees.
- The price of the model: rewards and benefits that buy member spending are the largest expense, and the loan book must be funded and reserved against losses.
- Main risks: a credit-cycle turn, premium-customer concentration, the rewards cost arms race, regulatory and legal costs, funding costs, and valuation.
- What matters most: billed business, net card fees versus rewards growth, write-off and delinquency rates, the reserve level, capital ratios, and whether buyback dollars actually shrink the share count.
What American Express actually does: one company, four jobs
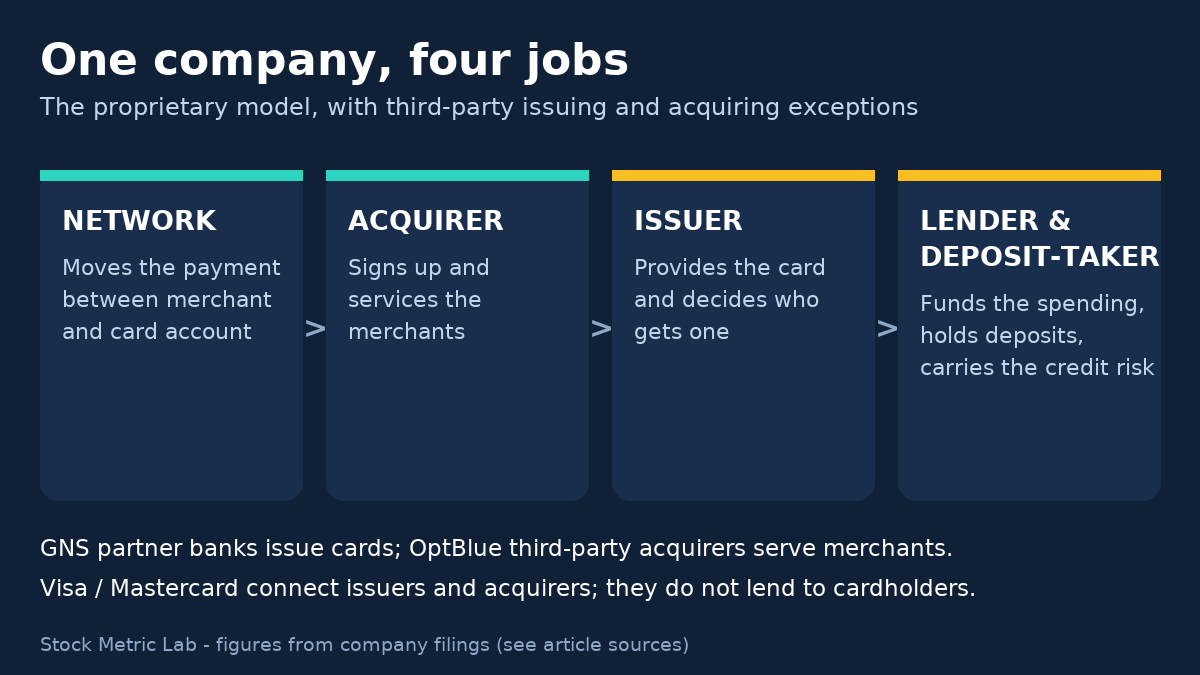
When a customer pays with an American Express card, four jobs happen at once. The network moves the payment between the merchant and the card account. The acquirer side signs up and services the merchant. The issuer provided the card and decided who qualified for it. And the lender funded the purchase until the customer pays the bill — while the company’s bank subsidiary also holds customer deposits.
Visa and Mastercard do only one of these jobs directly: they operate the network that connects the two sides of a transaction. They do not issue the cards — banks and other issuers provide them and carry the loans — and they are not the merchant acquirers either: separate acquirers (often banks or payment processors) sign up and service the merchants at the other end of the network. American Express — a “closed loop” — combines all four roles in its proprietary model, while third-party acquirers also participate in merchant acceptance. That single structural fact explains almost everything else in this article: why its revenue per dollar of spending is higher, why it has a credit-quality section at all, and why the cash flow statement needs a different reading method than Visa’s.
The proprietary closed loop has two distinct partner exceptions. Under Global Network Services (GNS) network agreements, third-party banks and other institutions issue American Express-branded cards; those issuers generally fund and bear the cardholder balances they issue. Under OptBlue, third-party acquirers contract with and service merchants and determine merchant pricing. OptBlue changes the merchant-contracting and acquiring role; it does not by itself change the card issuer or transfer cardholder lending risk. When an Amex-issued card is used at an OptBlue merchant, Amex retains its cardholder lending exposure. The GMNS segment contains merchant and network activities, while the issuing segments report their card-issuing businesses.
Latest financial snapshot
Reviewed November 2, 2026 using American Express’s Form 10-Q for the quarter ended September 30, 2026 (filed October 23, 2026) and its Q3 2026 earnings release of the same date. Dollar amounts are in billions unless noted; parenthetical changes are year over year. GAAP and adjusted (non-GAAP) EPS are shown separately, and one-off items inside the quarter are identified wherever they appear.
| Metric | Q3 2026 | Nine months 2026 |
|---|---|---|
| Total revenues net of interest expense | $20.062B (+9%) | $58.606B (+10%) |
| GAAP net income | $3.712B (+28%) | $9.794B (+17%) |
| GAAP diluted EPS | $5.42 (+31%) | $14.22 (+20%) |
| Adjusted diluted EPS (non-GAAP) | $4.68 (+13%) | $13.49 (+14%) |
| Billed business | $454.0B (+8%) | $1,337.7B (+9%) |
| Provisions for credit losses | $0.985B (−23%) | $3.320B (−14%) |
Read the EPS lines carefully this quarter. Q3 2026 includes two one-off items from the sale of the company’s equity interest in Global Business Travel Group (GBTG), which closed on September 29, 2026: a pre-tax gain of $982 million, and a related restructuring charge of $336 million pre-tax (tied to eliminating approximately 5% of global positions). The company’s adjusted EPS removes both, after tax:
GAAP diluted EPS $5.42 − GBTG gain on sale, after tax $1.11 + restructuring charge, after tax $0.37 = adjusted diluted EPS $4.68 (Q3 2026; nine months: $14.22 − $1.10 + $0.37 = $13.49). Adjusted net income was $3.214B in Q3 (+11%). Source: earnings release, Appendix I reconciliation.
Adjusted EPS is a starting point, not a clean run-rate either. The 10-Q reports a $400M increase in legal reserves covering the previously unreserved portion of the OCC penalty and unrelated proceedings (Note 11), and attributes the quarter’s lower tax rate primarily to discrete tax benefits (Note 12). Credit-reserve model enhancements also affected provisions. These filing-supported observations do not establish per-share effects or that the items offset one another. The quarter’s effective tax rate was 18.1%, down from 24.1% a year earlier, mainly because of those discrete tax benefits; a normalized tax rate would make the quarter’s underlying growth look smaller. On our calculation from the release’s reconciliation items, pre-tax income excluding the gain and adding back the restructuring charge was $3.885B, up only about 1.6% from $3.825B a year earlier — a useful reminder that the headline +18% pre-tax growth is mostly the one-off gain.
Guidance, in management’s words: with the Q3 release, the company raised its full-year 2026 EPS guidance to $18.30–$18.60 on a GAAP basis and $17.60–$17.90 on an adjusted basis, and said it is “on track to deliver another year of 10 percent revenue growth.” (For reference, fiscal 2025 GAAP diluted EPS was $15.38.)
The revenue engines
American Express has four revenue engines, and only the first resembles Visa’s model. The figures below are from the Q3 2026 Form 10-Q income statement (quarter) and the fiscal 2025 Form 10-K (full-year mix).
| Engine | Q3 2026 | Fiscal 2025 | Share of FY2025 revenue |
|---|---|---|---|
| Discount revenue | $10.169B (+8%) | $37.401B (+6%) | 51.8% |
| Net interest income | $4.940B (+10%) | $17.364B (+12%) | 24.0% |
| Net card fees | $2.969B (+16%) | $9.993B (+18%) | 13.8% |
| Service fees and other revenue | $1.984B | $7.471B (+10%) | 10.3% |
| Total revenues net of interest expense | $20.062B (+9%) | $72.229B (+9.5%) | 100% |
Shares are our calculation from the 10-K lines. “Total revenues net of interest expense” is the company’s headline revenue measure: interest earned — mainly on card balances, and also on deposits with banks and investment securities — is shown after deducting what the company pays for deposits and debt funding.
1. Discount revenue — the merchant’s toll
When a merchant accepts an Amex card, the merchant pays a discount fee. This is the engine closest to Visa’s and Mastercard’s network fees, and it moves with card member spending. It is the largest revenue line.
2. Net card fees — the membership subscription
Card members pay annual fees, and this is currently the fastest-growing engine (+16% in Q3 2026; +18% in fiscal 2025). Fee income is the purest expression of the “membership model”: customers pay for the card itself, before they spend anything. Watch whether fee growth survives each product refresh cycle — the fees are high, and so are the benefits members expect in return (see the cost section below).
3. Net interest income — the lending engine
Card members who carry a balance pay interest, and that is the largest part of this line — but not all of it: interest income also includes interest and dividends earned on the company’s deposits with banks and its investment securities. Net interest income is that total interest income minus interest expense on deposits and debt; it produced $4.940B in Q3 2026 (+10%). Visa and Mastercard have no equivalent line, because they do not lend. This engine grows with balances, not with spending — and it is the engine that creates credit losses.
4. Service fees and other revenue
Foreign-exchange conversion, travel and other service fees. In Q3 2026 this line should not be confused with the GBTG gain: the $982 million gain was recorded as a reduction of “other, net” expense in Corporate & Other (Form 10-Q, Note 1), not in revenue.
Spending: billed business
Billed business — spending on American Express cards, as the company defines the measure in its statistical tables — was $454.0B in Q3 2026, up 8% on both a reported and an FX-adjusted basis, and $1,337.7B for the nine months (+9%). Fiscal 2025 billed business was $1,670B. Within the quarter, travel & entertainment spending rose 10% and goods & services spending rose 7% (company-reported growth rates).
A definition caution when comparing across our payments coverage: billed business is not the same measure as Visa’s payments volume. The two series are built differently, so compare each company’s growth rate against its own history rather than placing the levels side by side as if they were the same statistic.
The cost of the membership model
Premium economics are bought, not free. Card Member rewards — points, cashback and statement credits — are the single largest expense line: $5.090B in Q3 2026 and $18.409B in fiscal 2025, roughly a quarter of revenue in both periods (our calculation). Add business development ($1.795B in Q3) and Card Member services ($2.006B) — lounges, travel benefits, servicing — and variable customer engagement costs totaled $8.891B in Q3 2026, growing faster than revenue. Marketing was $1.770B in the quarter, and total expenses were $14.546B (+9%).
This is the structural difference from the networks. Networks can spread technology and processing costs across large transaction volumes, but processing, security, personnel and client incentives still have economic costs; an additional transaction is not costless. An extra dollar of Amex spending triggers rewards costs, and richer benefits are the price of keeping premium members — and their annual fees — renewing. The checklist at the end of this article therefore pairs fee growth against rewards growth every quarter.
Credit quality: the section Visa doesn’t have
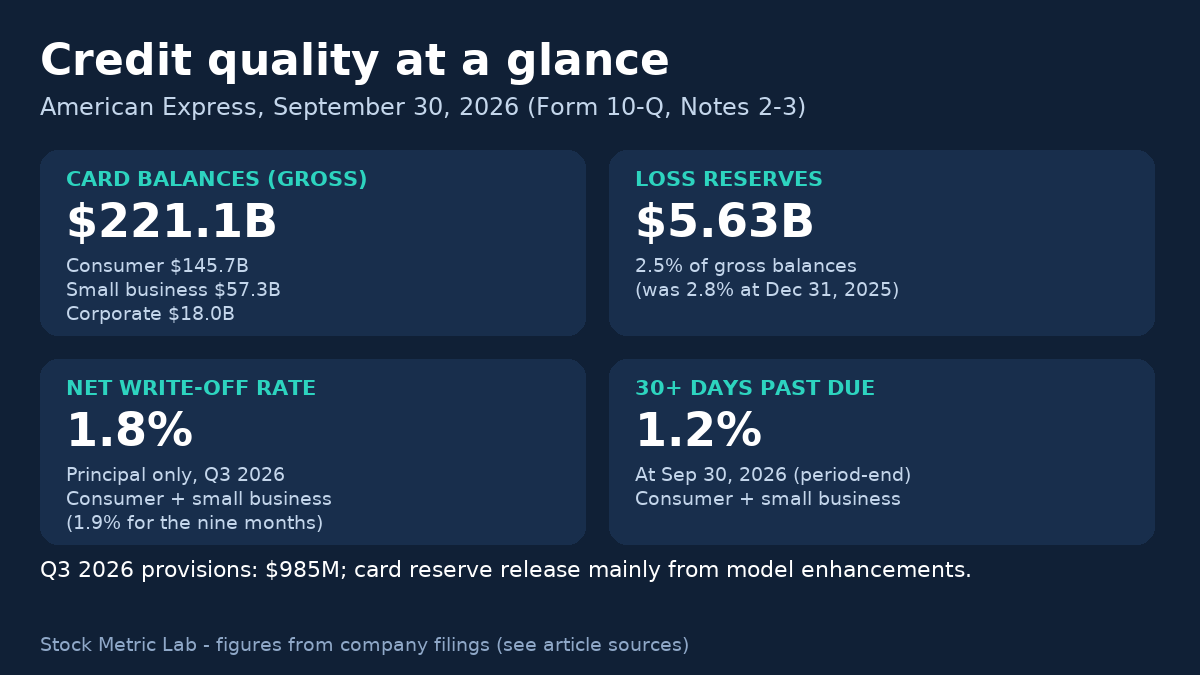
Because American Express lends, this table — not the revenue table — is where a downturn would appear first. All figures are from the Q3 2026 Form 10-Q, Notes 2–3. A terminology note: from Q1 2026 the company presents Card Member loans and receivables together as “Card balances”; earlier filings (including the fiscal 2025 10-K) split them, so do not mix the two presentations without noting the change.
The book (period-end, September 30, 2026):
| Item | Sep 30, 2026 | Dec 31, 2025 |
|---|---|---|
| Card balances, gross — Consumer | $145.733B | — |
| Card balances, gross — Small Business | $57.315B | — |
| Card balances, gross — Corporate | $18.026B | — |
| Card balances, gross — total | $221.074B | $213.863B |
| Reserves for credit losses (Card balances) | $5.634B | $6.089B |
| Reserves as % of gross balances | 2.5% | 2.8% |
The loss rates. The company’s headline rates — the ones quoted in the earnings release — cover consumer and small business card balances combined and are based on principal losses only (excluding interest and fees), annualized as the company presents them in its statistical tables. On that population and definition, the net write-off rate was 1.8% in Q3 2026 and 1.9% for the nine months ended September 30, 2026 — the same “1.8%” is often quoted without its period, so quote the period with it. The 30+ days past due rate of 1.2% is a period-end figure (September 30, 2026), not a period average. The 10-Q’s credit-quality table (Note 2) breaks the portfolios down further: for the nine months, consumer net write-offs were 1.8% principal-only (2.2% including interest and fees) and small business net write-offs 2.3% principal-only; at September 30, 2026, 30+ days past due stood at 1.2% for consumer balances and 1.3% for small business balances. Corporate balances are measured differently (90+ days past billing: 0.3%), and a corporate principal-only write-off rate is not available in the filing. When you quote “the” write-off rate, quote its population and its period with it — 1.8%, 1.9% and 2.3% are all correct answers, for different portfolios and different periods.
Provisions. Provisions for credit losses were $985 million in Q3 2026, down from $1,287 million a year earlier, and $3.320B for the nine months (from $3.842B). The earnings release explains the Q3 decline as a reserve release in 2026 versus a reserve build in the prior-year quarter, partly offset by higher net write-offs. The 10-Q attributes the Q3 card-balance reserve release primarily to enhancements to expected-credit-loss models from the periodic review process, partly offset by sequential card-balance growth. This is a change in the required estimate of expected losses, rather than an arbitrary withdrawal of a surplus cushion. Releases flatter a quarter’s profit; builds depress it. Neither moves cash by itself: provisions and write-offs are non-cash accounting entries. The cash left the company earlier, when the spending was funded and the balance was created; a write-off only recognizes that some of it will not come back.
A beginner’s paragraph on the reserve itself: under the CECL accounting standard, the company must hold a reserve today for the losses it expects over the life of today’s balances, estimated with models of default probability, exposure and recoveries. Approximately three years is the reasonable-and-supportable economic forecast period, not a limit on the lifetime-loss assessment. Beyond that period, the company immediately reverts to long-term average loss rates (10-Q, Note 3). The $5.634B reserve — 2.5% of gross balances — is that estimate, not a pile of cash set aside. When the economy or the portfolio mix changes, the estimate moves, and the movement runs through provisions in the income statement.
Funding and capital: deposits, debt, and a bank regulator
The lending book is funded mainly by customers and bond markets. At September 30, 2026 (Form 10-Q balance sheet, period-end): customer deposits were $155.019B (up from $152.488B at December 31, 2025), long-term debt was $58.538B, total assets were $310.275B, and total shareholders’ equity was $35.797B.
American Express is a bank holding company under the Bank Holding Company Act of 1956. The Federal Reserve is its primary federal regulator, and its bank subsidiary, American Express National Bank, is supervised by the OCC. Two consequences matter for shareholders:
- Capital requirements gate the returns. The key yardstick is the CET1 ratio — common equity tier 1 capital divided by risk-weighted assets, measured under the Basel III capital framework as implemented in the United States. At September 30, 2026, the company’s CET1 ratio was 10.9% (Form 10-Q, MD&A capital disclosures), reported together with the target range the company manages to. Like other large bank holding companies, American Express is also subject to the Federal Reserve’s annual stress tests, and the resulting capital requirements influence how much it may return through buybacks and dividends.
- Regulators can impose costs directly. In October 2026 the OCC and the Federal Reserve issued consent orders over deficiencies in the company’s financial-crimes (BSA/AML) compliance program, including a $350 million civil money penalty against American Express National Bank. The company’s Form 8-K of October 8, 2026 states that a portion of the penalty was reserved for in prior periods — the filing does not establish a per-share earnings impact here — and that the orders do not impose an asset cap and are not expected to change fiscal 2026 guidance or affect 2027 guidance. Remediation will still consume management attention and compliance spending for some time.
Cash flow, read correctly
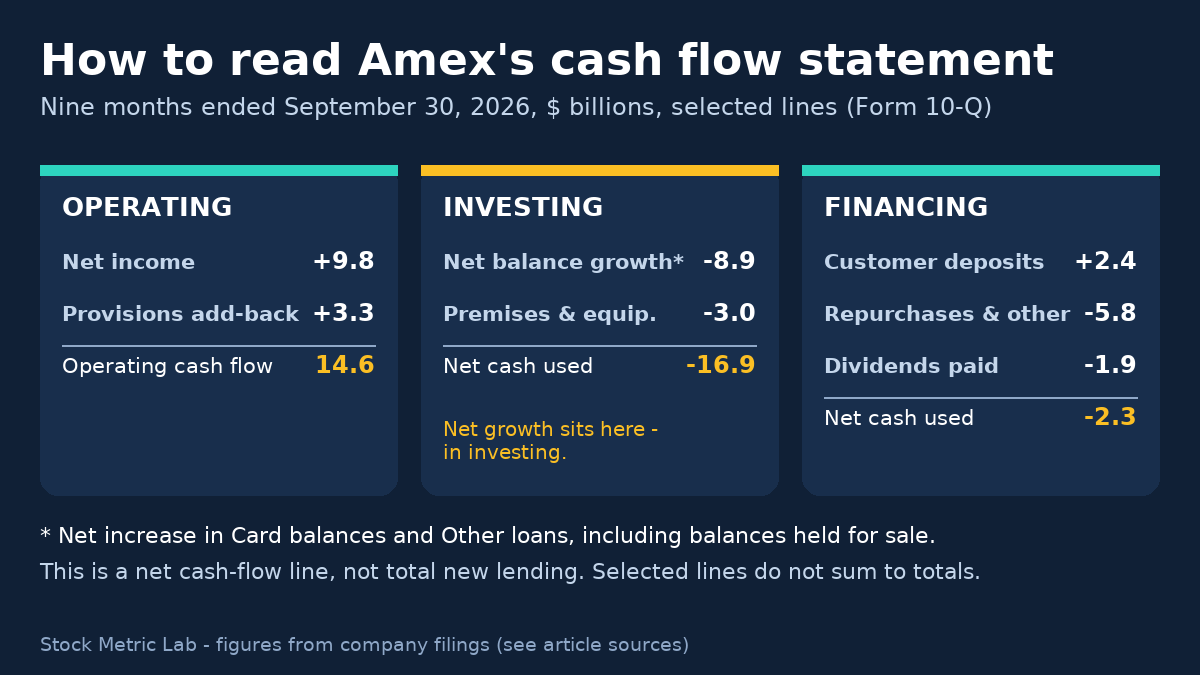
This is the section where American Express most punishes a borrowed method. On our Visa analysis we compute a “simple FCF” — operating cash flow minus capital purchases — because for a network that is a reasonable first pass. Here is the same walk through Amex’s nine months ended September 30, 2026 (Form 10-Q cash flow statement), with each flow in the section where the filing actually puts it:
- Operating: net income $9.794B; provisions for credit losses of $3.320B are added back (they are a non-cash expense estimate); the statement’s aggregated “other” adjustments line is −$2.825B (the filing combines several reconciling items in this line, so we do not attribute it to any single item). Net cash provided by operating activities: $14.559B — down from $15.361B a year earlier, even though net income rose from $8.371B; the reconciliation shows a smaller provisions add-back than a year earlier ($3.320B, against $3.842B) alongside that negative “other” line.
- Investing: the net increase in Card balances and Other loans, including Card balances held for sale, used $8.878B. This is net balance growth, not total new lending. This cash-flow line is classified in investing. Separately, the statement reports a $69M net decrease in Card balances held for sale in operating activities. Purchases of premises and equipment, net, were −$2.994B. Net cash used in investing: −$16.884B.
- Financing: customer deposits added +$2.446B; long-term debt added a net +$3.072B; share repurchases and other used −$5.805B; dividends paid used −$1.916B. Net cash used in financing: −$2.345B. Cash and equivalents fell $4.589B over the nine months, to $43.203B at September 30, 2026.
The arithmetic exists — and it still misleads. Nothing stops anyone from computing operating cash flow minus equipment purchases for Amex: $14.559B − $2.994B = $11.565B for the nine months (our calculation; operating cash flow less purchases of premises and equipment, net, nine months ended September 30, 2026). We show it only to explain why we do not compare it with Visa’s simple FCF:
- It excludes the investing cash outflow for net balance growth. The $8.878B net increase in Card balances and Other loans, including balances held for sale, bypasses this shortcut; it is not a measure of total loan originations.
- The funding side is invisible. Deposits that fund those loans arrive in financing; a network-style FCF treats the growth as if it were free.
- Provisions are added back inside operating cash flow, although expected credit losses are a real, recurring cost of lending — they are this industry’s cost of goods sold, not a one-off.
- A regulated bank holding company must hold capital against balance-sheet growth (see the CET1 discussion above), so operating cash is not automatically cash available to distribute.
For the same reason, we do not print a headline ROIC for American Express. Our usual definition — after-tax operating profit divided by invested capital (debt plus equity, less excess cash) — is built for companies where debt is a financing choice. For a lender, deposits and debt are raw material: they fund the assets, and their cost is already deducted inside net interest income. Include them in “invested capital” and the denominator is dominated by that raw material, so the ratio stops measuring what it measures for an industrial company; exclude them and the capital base pretends the loans fund themselves. Either way, the result is not comparable with the ROIC figures used elsewhere on this site. The definition, and its limits, matter more than any single number — for the framework itself, see ROIC explained and ROIC vs ROE. For a financial company, the readable capital measures are return on equity and the regulatory capital ratios — read with the cautions in the next section. (Our general explainer on the cash-flow concept itself is free cash flow, explained.)
Capital returns and the ROE question
For the nine months ended September 30, 2026, the cash flow statement shows $5.805B on the line “Repurchase of American Express common shares and other” — quote it with its full label: it is the repurchases-and-other line, not a pure buyback total. Dividends paid were $1.916B, and dividends declared were $0.95 per common share for Q3 2026, up 16% from $0.82 a year earlier ($2.85 declared for the nine months; declared dividends of $1.938B were roughly 20% of nine-month net income, our calculation). The share count moved as buybacks intend: shares outstanding fell from 686 million at December 31, 2025 to 671 million at September 30, 2026, and average diluted shares were 674 million in Q3, 3% fewer than a year earlier.
ROE, with two warnings. Return on average equity is the profitability ratio the company itself headlines for this balance sheet — net income divided by average total shareholders’ equity, presented annualized in the MD&A summary table (Table 1) of each filing. The company reported 42.4% for Q3 2026 and 38.0% for the nine months ended September 30, 2026, both annualized. However high the printed figure, read it with two cautions. First, buybacks shrink the denominator: total equity of $35.797B supports $310.275B of assets (our calculation: equity is about 11.5% of assets), and decades of repurchases keep that equity base — and therefore the ROE denominator — small. A high ROE partly measures a thin equity base, not only operating skill; that is exactly the caution we apply in our ROIC coverage when a company’s equity has been bought down. Second, Q3 2026’s numerator contains the one-off GBTG gain, so the quarter’s ROE overstates the run-rate; the adjusted earnings figures in the snapshot are the better numerator for a normalized view.
Segments in one table
American Express reports four segments plus Corporate & Other: U.S. Consumer Services (USCS), Commercial Services (CS), International Card Services (ICS), and Global Merchant and Network Services (GMNS — the closest thing to a “Visa-like” business inside the group, earning merchant and network fees). Segment revenues for the quarter ended September 30, 2026 (Q3 2026 statistical supplement, Ex. 99.2, p. 7):
| Q3 2026 ($M) | USCS | CS | ICS | GMNS | Corporate & Other | Consolidated |
|---|---|---|---|---|---|---|
| Total revenues net of interest expense | 9,840 | 4,553 | 3,682 | 2,082 | (96) | 20,062 |
(The segment figures as printed sum to $20,061M against the stated consolidated total of $20,062M — a $1M rounding difference in the source table.)
U.S. Consumer is the largest revenue pool, and GMNS is the piece that behaves most like a network business, because it carries almost no credit cost. Note also where one-offs land: in Q3 2026, both the GBTG gain and the restructuring charge were recorded in Corporate & Other (Form 10-Q, Note 1), and the January 2026 consolidation of Swisscard sits inside ICS.
Risks investors should not ignore
- Credit-cycle turn: write-off and delinquency rates improved year over year in 2026, and Q3 earnings benefited from a reserve release. Loss rates at these levels have little room to improve and a full cycle to worsen through; a normalization of write-offs would raise provisions and cut earnings even if spending held up.
- Premium and travel concentration: the model depends on affluent consumers and travel & entertainment spending — resilient categories, but concentrated ones. A downturn that reaches high-income households, or a travel shock, hits billed business, fees and credit at the same time.
- The rewards arms race: engagement costs (rewards, business development, Card Member services) grew faster than revenue in Q3 2026 — about 16% against 9% revenue growth (our calculation from the 10-Q lines). If competitors force richer benefits for the same fees, the membership model’s margins compress from inside.
- Regulatory and legal costs: the October 2026 OCC/Federal Reserve consent orders and the $350 million penalty (see Funding and capital) are the current, dated example of a standing exposure: financial-crimes compliance remediation will cost money over multiple periods, and the Form 10-Q’s legal proceedings note lists further pending matters. Pricing regulation (acceptance fees, interest and fee caps) is a recurring theme in the company’s own risk disclosures.
- Funding costs: net interest income depends on the spread between what card balances earn and what deposits and debt cost. Deposit competition or higher rates can narrow that spread even while balances grow.
- Execution and one-off discipline: Q3 2026 contained a $336 million restructuring charge tied to eliminating roughly 5% of positions, funded from the GBTG gain. Investors should check that “one-off” charges do not become an annual habit, and that the savings actually arrive.
- Valuation risk: a high-quality franchise can still be a poor investment at the wrong price — see the framework below.
American Express vs Visa vs Mastercard: three models, one industry
Card payments support different business models:
| Visa | Mastercard | American Express | |
|---|---|---|---|
| Runs the network | Yes | Yes | Yes |
| Signs up merchants (acquiring) | Merchant acquirers | Merchant acquirers | Amex itself, plus OptBlue acquirers |
| Issues the cards | Banks | Banks | Amex itself, plus GNS partner banks |
| Lends to cardholders | Issuers | Issuers | Amex on its own book; partner issuers on theirs |
| Cardholder lending losses | Issuers | Issuers | Amex on its own book; partner issuers on theirs |
| Settlement / counterparty risk | Network guarantees can create exposure | Network guarantees can create exposure | Network and acquiring obligations can create exposure |
| Takes deposits | No | No | Yes |
| Main revenue | Network & processing fees | Network & services fees | Discount revenue, card fees, interest |
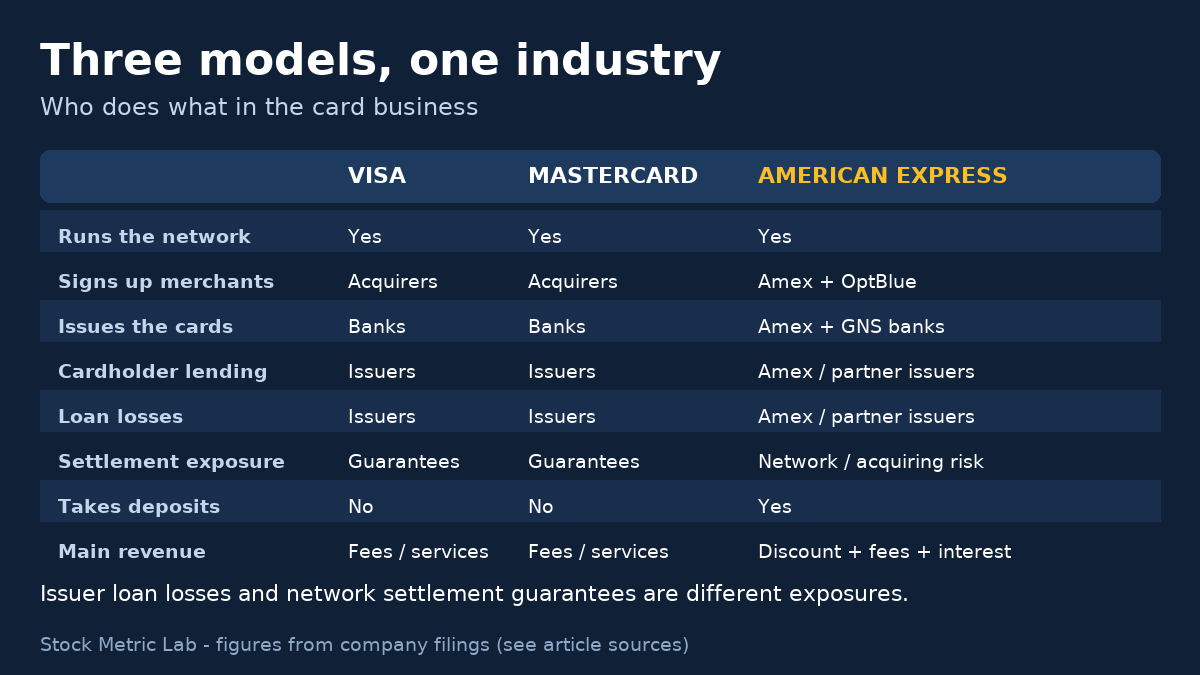
Practically: Visa and Mastercard primarily earn network, processing and service fees rather than cardholder lending spreads. Issuers generally carry cardholder loan losses, but the networks retain settlement-guarantee and counterparty exposures, alongside operational and legal risks. American Express earns the toll plus the lender’s spread plus the membership fee, and in exchange owns the losses when cardholders cannot pay. Neither model is simply “better”; they fail in different ways, which is why this site reads their statements with different checklists. Our Visa analysis covers the network model in the same format. The Mastercard analysis adds a closer look at services, rebates and incentives, and the bridge from operating cash flow to two defined FCF measures.
A practical valuation framework
Rather than anchor on a single price target, value American Express on normalized earnings and test the downside:
- Normalize the numerator. Start from adjusted EPS ($4.68 in Q3 2026; guidance of $17.60–$17.90 adjusted for fiscal 2026), not the GAAP figure containing the GBTG gain — then normalize the tax rate, which at 18.1% in Q3 flattered the quarter, and assess reserve releases as revisions to estimated expected losses, rather than recurring operating growth; the Q3 card-balance release primarily reflected model enhancements.
- Price the credit cycle, not the quarter. Ask what provisions look like if write-offs on consumer and small business balances (1.9% principal-only for the nine months of 2026; 1.8% in Q3) drift back toward stressed levels, and whether earnings still cover the dividend and a sensible buyback at that run-rate.
- Check the fee engine against its cost. Net card fees rose 16% in Q3, while engagement costs (rewards, business development and Card Member services) rose about 16%. These rates apply to different dollar bases and different activities; matching growth rates do not establish break-even economics or an unchanged membership margin. Compare the dollar increases and the relevant revenue and cost components. Engagement costs grew faster than total revenue (+9%).
- Demand a margin of safety for the regulated balance sheet. A lender’s book value is an estimate (reserves are models, not facts), and regulatory costs arrive in steps, as October 2026 showed. Compare the earnings yield on normalized EPS with the company’s own history and with lower-risk alternatives, and require the downside case — slower spending, normalizing credit, persistent compliance costs — to still make sense before treating quality as safety.
American Express is also one of Berkshire Hathaway’s largest and longest-held equity positions — a fact about the register, not a valuation. Our Berkshire Hathaway analysis looks at the holder; this page looks at the holding.
Quarterly checklist for American Express shareholders
- Billed business growth (reported and FX-adjusted), and the travel & entertainment versus goods & services split.
- Net card fee growth against Card Member rewards growth — is the membership engine gaining or leaking margin?
- Net write-off rate for the quarter and 30+ days past due at period-end, quoted with their population (consumer and small business, principal only) and their period — trend, not level.
- Reserves as a percentage of gross card balances, and whether the quarter was a release or a build.
- CET1 ratio against the company’s stated target range (both in the filing’s capital disclosures), since it gates capital returns.
- Repurchase dollars (the “repurchases and other” cash-flow line) versus the actual decline in shares outstanding.
- Provisions against balance growth — losses recognized in step with the book, or lagging it?
Bottom line
American Express is the premium, vertically integrated version of the card business: it keeps the merchant toll, the membership fee and the lender’s spread, and in return funds the loans, holds the deposits, reserves for the losses and answers to bank regulators. Q3 2026 showed the model’s strengths — record revenue of $20.062B (+9%), card fees up 16%, credit metrics still improving — alongside its permanent frictions: engagement costs growing faster than revenue, a $350 million regulatory penalty, and a headline EPS ($5.42) that a one-off sale gain lifted well above the adjusted $4.68.
For a disciplined investor, the debate is not whether this is a good business. It is whether normalized earnings — after through-cycle credit costs, a normal tax rate and ongoing compliance spending — justify the price, with a margin of safety for a balance sheet whose biggest numbers are estimates.
Frequently asked questions
Is American Express a bank? It is a bank holding company supervised by the Federal Reserve, and its subsidiary American Express National Bank — which issues many of its cards and holds its deposits — is supervised by the OCC. That is why it reports bank-style capital ratios (such as CET1) that Visa and Mastercard do not.
Why does American Express earn more per swipe than Visa? Because Amex combines merchant discount revenue, annual membership fees and interest on eligible carried balances within the same customer relationship. Visa earns network, processing and other service revenue rather than the issuer’s cardholder lending spread. Banks and other issuers provide the cards and credit. Annual fees apply at the account level, and interest applies only to relevant balances, so these are not three fees on every swipe.
Why is there no “free cash flow” figure here like in the Visa analysis? The arithmetic can be done (operating cash flow minus equipment purchases), but for a lender the result excludes the loan book’s growth — the main use of cash — which sits in investing activities, and ignores the deposit funding and regulatory capital the growth requires. The cash flow section above walks through the statement section by section instead of printing a shortcut that misleads. Our explainer on free cash flow covers the concept and where it applies.
What is the difference between the $5.42 and $4.68 EPS figures? Both are Q3 2026 diluted EPS. $5.42 is GAAP and includes the $982 million pre-tax gain on the GBTG stake sale, net of a related restructuring charge. $4.68 is the company’s adjusted (non-GAAP) figure excluding both items after tax: $5.42 − $1.11 + $0.37. The reconciliation is in Appendix I of the earnings release.
Why do the write-off rates differ between sources (1.8% vs 1.9% vs 2.3%)? They describe different portfolios and different periods. 1.8% is the Q3 2026 headline rate for consumer and small business balances combined (principal only); the combined rate for the nine months is 1.9%. Within the 10-Q’s nine-month table, consumer balances alone are 1.8%, while small business balances are 2.3%. Always quote the population, the period and the definition (principal only, or including interest and fees) with the rate.
Primary sources
Sources reviewed November 2, 2026; financial snapshot is Q3 / nine months ended September 30, 2026 unless otherwise labeled.
- Form 10-Q for the quarter ended September 30, 2026 (filed October 23, 2026) — SEC. Used for: income statement, balance sheet and cash flow statement (Part I, Item 1); the GBTG gain and the “Card balances” presentation change (Note 1); credit quality, balances and reserves (Notes 2–3); capital returns and dividends (statements of cash flows and shareholders’ equity); return on average equity (MD&A summary table) and the CET1 ratio (MD&A capital disclosures).
- Q3 2026 earnings release, Form 8-K Exhibit 99.1 (furnished October 23, 2026) — SEC. Used for: headline results, billed business, provisions narrative, the adjusted EPS definition and reconciliation (Appendix I), and fiscal 2026 EPS guidance.
- Form 8-K, Item 7.01 (furnished October 8, 2026) — SEC. Used for: the OCC/Federal Reserve consent orders, the $350 million civil money penalty against American Express National Bank, the statement that a portion was reserved for in prior periods, the absence of an asset cap, and the guidance statements.
- Form 10-K for the fiscal year ended December 31, 2025 — SEC. Used for: fiscal 2025 revenue lines and mix, rewards expense, provisions and business description (Parts I–II).
- Q3 2026 statistical supplement, Form 8-K Exhibit 99.2 (quarter ended September 30, 2026) — SEC. Used for: the segment revenue table (p. 7).
- Q1 2026 statistical supplement, Form 8-K Exhibit 99.2 — AXP Investor Relations (PDF). Used for: confirming December 31, 2025 period-end figures (proprietary cards-in-force of 86.6 million; shares outstanding of 686 million) and the quarterly billed-business series behind fiscal 2025 billed business of $1,670B.
- Visa fiscal 2025 Form 10-K, Note 12 (Settlement Guarantee Management) — SEC. Used for distinguishing network settlement guarantees from cardholder lending losses.
Disclosure: This article is for education and research only and is not individualized investment advice. Financial data can change; verify figures in the company’s latest filings before making an investment decision.