
Mastercard Incorporated (NYSE: MA) is the smaller of the two global card networks. Like Visa, Mastercard does not issue cards, does not lend, and does not sign up merchants: banks and acquirers do those jobs, and Mastercard runs the network in the middle. What distinguishes it in the filings is how much of its revenue now comes from the layer around the transaction — fraud tools, data services, consulting, account-to-account and real-time payment capabilities — and how large the rebates-and-incentives deduction has become: in the third quarter of 2026, rebates and incentives equal to more than half of the payment network's gross revenue were deducted before net revenue remained. Rebates and incentives reduce reported revenue, and the amount recognized in a period is not the same as cash paid to customers in that period — recognition and payment timing can differ. This analysis explains the model from the company's own filings, with free cash flow computed on two explicit definitions — the same discipline we apply in our Visa analysis.
Mastercard investment thesis in one minute
- A pure network, like Visa: Mastercard operates the rails and the rules; issuers lend and carry the cardholder credit risk, acquirers service merchants. There is no loan book and there are no deposits. The credit exposure Mastercard itself carries is of a different kind — it stands as guarantor of settlement between its customers — and the model section below keeps the two kinds of risk separate.
- Two revenue engines: the payment network (59% of Q3 2026 net revenue) and value-added services and solutions (41%, and growing faster — +19% in Q3 2026 against the network's +11%).
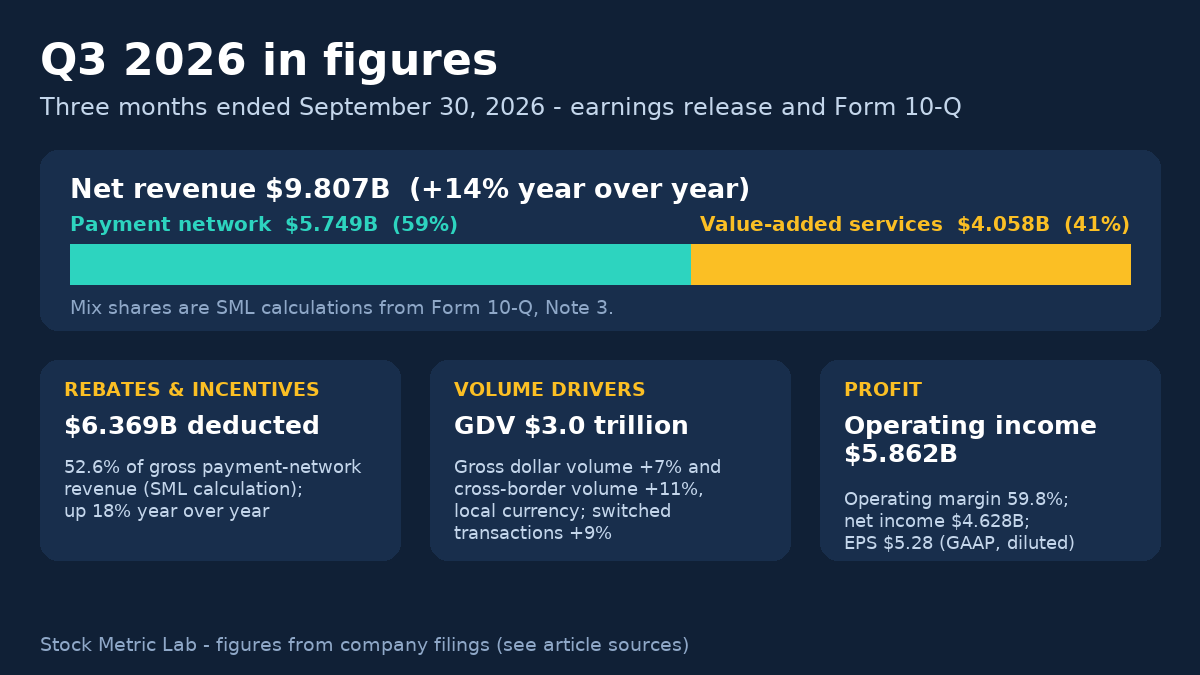
- The gross-to-net bridge is the story: rebates and incentives of $6.369B were deducted in Q3 2026 — 52.6% of gross payment-network revenue (our calculation) — and they grew 18%, faster than the network's net revenue. Watching that ratio is the Mastercard equivalent of watching Visa's client incentives.
- Cash conversion with a footnote: on the broader of our two definitions, free cash flow was $10.718B in the first nine months of 2026, 83% of net income — down from 107% a year earlier, because operating cash flow fell even as profit rose. The cash flow section shows exactly why, line by line.
- Main risks: interchange regulation and the long-running merchant litigation, incentive competition with Visa, alternative payment rails (account-to-account, real-time payments, stablecoins), customer concentration and renegotiations, and valuation.
What Mastercard actually does: the network in the middle
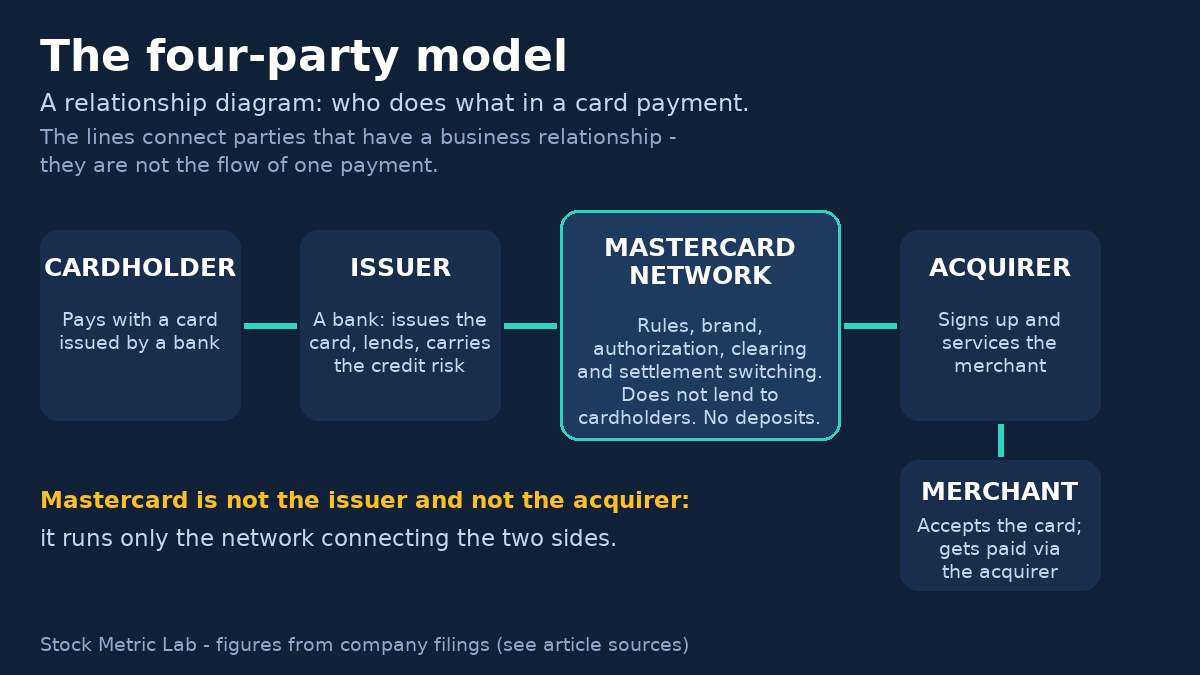
A card payment involves four parties. The cardholder pays. The issuer — a bank or other financial institution — provided the card, extends the credit or holds the deposit account, and carries the risk if the cardholder does not pay. The acquirer — usually a bank or payment processor — signs up the merchant and services the acceptance side. Between the issuer and the acquirer sits the network: it sets the rules and the brand standards, and it switches the transaction — authorization, clearing and settlement — from one side to the other.
Mastercard is only the network. It does not issue the cards (its customers, the financial institutions, do; as of September 30, 2026 they had issued 3.8 billion Mastercard- and Maestro-branded cards, per the Q3 2026 earnings release). It does not lend the money, takes no deposits, and is not the acquirer. That is the same structural position as Visa's, and it is the opposite of American Express, which issues its own cards and lends on them.
Two kinds of credit risk run through this model, and they belong to different parties. Cardholder credit risk — the risk that a cardholder does not repay what was borrowed on the card — belongs to the issuer that extended the credit; Mastercard does not carry it, which is why its statements have no cardholder credit-quality section of the kind American Express publishes. Settlement risk is different: the network's rules make Mastercard a guarantor of settlement between its customers, so if a member institution failed to meet its settlement obligations, the loss could fall on Mastercard. The Form 10-Q's own risk list includes "exposure to loss or illiquidity due to our role as guarantor." So the precise statement is not that Mastercard has no credit exposure; it is that its exposure runs to member institutions' settlement obligations, not to consumers' card balances.
Latest financial snapshot
Updated October 31, 2026 using Mastercard's Q3 2026 earnings release (furnished October 29, 2026 as Form 8-K Exhibit 99.1) and its Form 10-Q for the quarter ended September 30, 2026 (filed October 29, 2026). Dollar amounts are in billions unless noted; parenthetical changes are year over year. GAAP and adjusted (non-GAAP) figures are shown separately. Note the period discipline used throughout this article: the income statement is published for both the quarter and the nine months, but the cash flow statement is published on a nine-month cumulative basis only — there is no Q3-only cash flow figure anywhere below.
| Metric | Q3 2026 (three months ended Sep 30, 2026) | Nine months ended Sep 30, 2026 |
|---|---|---|
| Net revenue | $9.807B (+14%) | $27.482B (+15%) |
| Operating income | $5.862B (+16%) | $16.356B (+17%) |
| Operating margin | 59.8% (vs 58.8%) | 59.5% (vs 58.3%) |
| Net income | $4.628B (+18%) | $12.898B (+18%) |
| Diluted EPS (GAAP) | $5.28 (+22%) | $14.59 (+22%) |
| Adjusted diluted EPS (non-GAAP) | $5.31 (+21%) | $14.94 (+22%) |
| Operating cash flow | — (not presented for the quarter) | $11.859B (vs $12.646B) |
| Free cash flow, definition (a) | — (not presented for the quarter) | $11.192B (our calculation) |
| Free cash flow, definition (b) | — (not presented for the quarter) | $10.718B (our calculation) |
The GAAP-to-adjusted gap is small — and it is mostly litigation. Adjusted EPS removes (gains) losses on equity investments and the company's "special items." Here is the Q3 2026 bridge exactly as reconciled in the release (p. 11), with each component shown net of its tax effect: GAAP diluted EPS of $5.28, plus $0.06 for litigation provisions — a $74 million pre-tax charge, primarily for settlements with merchants who opted out of the U.S. merchant class litigation (the "provision for litigation" line in the income statement), worth $49 million net of tax — minus $0.03 for (gains) losses on equity investments — a $5 million pre-tax loss in the quarter, shown in the reconciliation as a −$24 million net-of-tax effect — equals adjusted diluted EPS of $5.31 (adjusted net income $4.653B). Note that the two components are not the same kind of adjustment: one adds back a charge, the other removes an investment result together with its tax effects, which is why a small pre-tax loss can carry a larger net-of-tax figure. For the nine months, the excluded items were litigation provisions of $156 million and a restructuring charge of $202 million (taken in the first quarter of 2026), plus $73 million of losses on equity investments; adjusted net income was $13.209B against GAAP net income of $12.898B (earnings release, non-GAAP reconciliations). Two habits are worth forming here: litigation provisions are a recurring "special item" at both card networks, and the adjusted figures are a starting point for analysis, not a cleaner truth.
Guidance: We did not identify a numeric outlook in the Q3 2026 earnings release and Form 10-Q reviewed for this article, so none is presented here. Everything below is either a reported actual or a calculation labeled as ours.
The two revenue engines
Mastercard disaggregates net revenue into exactly two categories (Form 10-Q, Note 3). Both are stated net of rebates and incentives, which are attributed to the category to which they pertain.
| Net revenue ($M) | Q3 2026 | Q3 2025 | Nine months 2026 | Nine months 2025 | Fiscal 2025 |
|---|---|---|---|---|---|
| Payment network | 5,749 | 5,179 | 16,148 | 14,556 | 19,476 |
| Value-added services and solutions | 4,058 | 3,423 | 11,334 | 9,429 | 13,315 |
| Net revenue | 9,807 | 8,602 | 27,482 | 23,985 | 32,791 |
Fiscal 2025 figures are from the fiscal 2025 Form 10-K (Note 3), via the team's alignment table. Mix shares (our calculation): value-added services were 41% of net revenue in Q3 2026 and in the first nine months, against about 41% in fiscal 2025 — a high and slowly rising share, growing faster than the network (+19% vs +11% in Q3 2026; +20% vs +11% for the nine months, as reported).
1. The payment network — assessments on volume and transactions
Inside the network, management monitors four assessment streams (Form 10-Q, MD&A). Assessments are the agreed standard pricing charged to customers before rebates and incentives; the company states explicitly that they do not represent net revenue — treat them as the gross engine room, not the top line.
| Key metrics, Q3 2026 ($M) | Amount | Change (as reported) |
|---|---|---|
| Domestic assessments | 3,211 | +14% |
| Cross-border assessments | 3,841 | +16% |
| Transaction processing assessments | 4,781 | +14% |
| Other network assessments | 285 | +10% |
| Total assessments | 12,118 | — |
- Domestic assessments are charged on activity where the merchant's country and the card's country of issuance are the same, driven mainly by domestic dollar volume and cards issued.
- Cross-border assessments are charged where the two countries differ, and are driven by cross-border dollar volume. Travel and cross-border e-commerce activity affect cross-border volume and related assessments.
- Transaction processing assessments — the largest of the four assessment streams in Q3 2026 — are driven by the number of switched transactions: authorization, clearing and settlement, plus connectivity and network access.
- Other network assessments are licensing, implementation and franchise fees.
An arithmetic tie-out worth noticing (our calculation): the four assessment streams sum to $12,118M in Q3 2026 — exactly the gross payment-network revenue implied by adding back the quarter's rebates and incentives to net payment-network revenue ($5,749M + $6,369M). The MD&A metrics and the revenue note describe the same engine from two sides.
2. Value-added services and solutions — the layer around the transaction
The second engine sells the services that surround the payment: fraud prevention and security, data analytics and consulting, loyalty and marketing services, issuing and acceptance support, and newer account-to-account and real-time payment capabilities. It grew 19% in Q3 2026 (as reported and currency-neutral), driven, in the company's words, by underlying volume drivers, demand across several services, and pricing, with a minimal decrease from acquisitions and dispositions. This is structurally the most interesting part of Mastercard's story: services revenue is less directly tied to the interchange-regulated transaction toll, deepens the customer relationship beyond the swipe, and is the main reason Mastercard's revenue mix differs from a pure switching utility.
Where this differs from Visa's presentation. Visa disaggregates net revenue into four categories (service, data processing, international transaction, other) less client incentives, and discloses "revenue from value-added services" as a cross-cutting subtotal recognized within three of those categories ($10.9B in Visa's fiscal 2025). Mastercard's value-added services and solutions is a reported revenue category in its own right ($13.315B in fiscal 2025; 41% of net revenue in Q3 2026). The two figures are built on different definitions over different fiscal years (Mastercard's year ends December 31; Visa's ends September 30) — compare the roles the services layer plays at each company, not the two numbers as if they were the same line.
The volume drivers, with their definitions
Mastercard's three headline drivers (definitions from the Form 10-Q, MD&A) are:
- Gross dollar volume (GDV) — the dollar volume of activity on Mastercard-branded cards, equal to purchase volume plus cash volume (cash disbursements, including balance transfers and convenience checks). Reported growth is on a local currency basis unless stated, to strip out exchange-rate movement.
- Cross-border volume growth — growth in the dollar volume where the merchant's country differs from the card's country of issuance, again on a local currency basis.
- Switched transactions — the number of transactions initiated and switched through the network.
| Driver | Q3 2026 | Nine months 2026 |
|---|---|---|
| GDV | $2,952B (release operating table; company narrative rounds to $3.0 trillion), +7% local currency | $8,523B, +7% local currency |
| Cross-border volume | +11% local currency (+10% in U.S. dollars) | +12% local currency (+15% in U.S. dollars) |
| Switched transactions | +9% (purchase transactions alone: 59,480M, +9.3%) | +9% (purchase transactions alone: 168,867M, +9.0%) |
Two cautions travel with these numbers. First, growth rates quoted "local currency" and "U.S. dollar" differ — Q3 cross-border growth is +11% on one basis and +10% on the other — so quote the basis with the rate. Second, effective in 2026 the company's key drivers include Venezuela cross-border activity (Form 10-Q, MD&A note), a comparability footnote worth knowing before extending the series backward. Compare each driver against its own history rather than against Visa's differently-built statistics (Visa's payments volume and processed transactions are similar ideas, not the same measures).
Rebates and incentives: the gross-to-net bridge
This is the section where Mastercard's economics are won or lost in negotiation. The assessments described above are the list price of the network. What issuers effectively pay is the list price minus rebates and incentives — contractual amounts, largely volume-linked, that Mastercard grants customers to win and renew issuing and acceptance deals. Mechanically they are a deduction from revenue (contra-revenue): the amount recognized as a deduction in a period is not the same as cash paid to customers in that period, because recognition and payment timing can differ. Net revenue is simply what remains once the deduction is subtracted, and the table below is that accounting bridge, from gross assessments to net revenue.
| Payment network ($M) | Q3 2026 | Nine months 2026 |
|---|---|---|
| Gross revenue (net revenue + rebates and incentives; our calculation) | 12,118 | 34,153 |
| Rebates and incentives (Form 10-Q, MD&A) | (6,369) | (18,005) |
| Net revenue — payment network | 5,749 | 16,148 |
| Rebates as a share of gross (our calculation) | 52.6% | 52.7% |
Read the growth rates as a pair: in Q3 2026 rebates and incentives grew 18% (as reported and currency-neutral), while payment-network net revenue grew 11%. For the nine months, rebates grew 21% as reported (19% currency-neutral) against net payment-network growth of 11% (9% currency-neutral). The company attributes the increase to growth in its key drivers plus new and renewed deals. The structural point for shareholders: when the rebate line grows persistently faster than the net line, part of the gross value of the network's volume growth is conceded in the negotiation — the Mastercard version of the dynamic our Visa analysis tracks as client incentives.
Do not compare the two percentages directly. Visa's client incentives were 28.5% of total revenue before incentives in fiscal 2026 (our calculation, as published in the Visa analysis); Mastercard's 52.6% is rebates as a share of gross payment-network revenue only, for a single quarter. Different numerators, different denominators, different periods. What is comparable is the direction and the discipline: at both networks, the incentives line must be watched against the net revenue it leaves behind.
Cash flow and free cash flow: two definitions, one cumulative period
Mastercard's cash flow statement for Q3 2026 is presented on a nine-month cumulative basis (nine months ended September 30, 2026) in both the release and the Form 10-Q. There is no company-presented Q3-only operating cash flow, and this article does not manufacture one by subtracting earlier quarters.
The nine-month walk, from the Form 10-Q cash flow statement:
- Operating: net income of $12,898M became operating cash flow of $11,859M — down from $12,646M a year earlier, even though net income rose from $10,908M. The statement shows why without any need for speculation: a $4,688M increase in prepaid expenses absorbed cash (against $2,939M a year earlier), partly offset by a $1,660M increase in accrued expenses and a $2,030M non-cash add-back for amortization of customer incentives. Profit up and operating cash down is not a contradiction; it is a working-capital and timing statement, and it is exactly the kind of quarter where a headline "FCF fell" needs the bridge below rather than a verdict.
- Investing: purchases of property and equipment were $667M and capitalized software $474M; acquisitions of businesses used $1,372M net of cash acquired (goodwill on the balance sheet rose to $10,804M at September 30, 2026, from $9,560M at December 31, 2025). Net cash used in investing: $2,603M.
- Financing: share repurchases (treasury stock purchases) used $11,893M and dividends paid used $2,311M, against debt proceeds of $5,596M after discounts and before debt repayments (the statement's "proceeds from debt, net of discounts") less $618M of payments on debt — net debt proceeds of $4,978M. Net cash used in financing: $9,425M. Cash and equivalents ended the period at $10,147M.
Free cash flow, on two definitions. Mastercard reports the two things a network spends to build its platform as separate cash flow lines — equipment purchases, and software it capitalizes — so we present free cash flow both ways, for identical periods, and label every figure with its definition (for the concept itself, see free cash flow, explained):
| Nine months ended Sep 30 | 2026 | 2025 |
|---|---|---|
| Operating cash flow | 11,859 | 12,646 |
| − Purchases of property and equipment | (667) | (377) |
| FCF (a) = OCF − PP&E | 11,192 | 12,269 |
| − Capitalized software | (474) | (548) |
| FCF (b) = OCF − PP&E − capitalized software | 10,718 | 11,721 |
| FCF (b) as a share of net income (our calculation) | 83% | 107% |
For the full-year anchor, fiscal 2025 (Form 10-K): operating cash flow $17,648M, PP&E $489M, capitalized software $726M — FCF (a) $17,159M and FCF (b) $16,433M. Total cash capex on the broader definition was 4.2% of net revenue in the first nine months of 2026 and 3.7% in fiscal 2025 (our calculation). The two definitions differ by exactly one line: definition (a) leaves the $474M of capitalized software (nine months) inside "free" cash flow, while definition (b) deducts it as investment. Both are printed, for the same periods, so the size of that difference is visible rather than decided for the reader.
The Visa comparison, done carefully. Our Visa analysis computes a "simple FCF" — operating cash flow minus Visa's single combined line, "purchases of property, equipment and technology" ($22.057B for Visa's fiscal 2026). Visa does not break capitalized software out of that combined line, so no Visa figure exists on Mastercard's definition (b), and Visa's combined-scope figure is not the same scope as either Mastercard definition: it subtracts more than (a) and cannot be equated with (b). Place the two companies' figures side by side only with their scopes and periods stated — which is what the comparison table at the end of this article does.
Capital returns and the balance sheet
For the nine months ended September 30, 2026, Mastercard returned more cash than its operations generated: repurchases of $11,893M were 100% of operating cash flow (our calculation), and repurchases plus dividends paid of $2,311M came to $14,204M against $11,859M of operating cash flow, with net debt proceeds of $4,978M (proceeds of $5,596M after discounts and before repayments, less $618M of payments on debt) inside the same period's financing. That is a deliberate, disclosed pattern for this company — but it means the balance sheet, not just the cash flow statement, is part of the returns story:
- Buybacks: $11,893M in the nine months (22.9 million shares at an average of $520.64, Form 10-Q MD&A), including $3.0B in Q3 alone (5.3 million shares). Remaining authorization was $5,568M at September 30, 2026 under the $14.0B program approved in December 2025 (a further $648M was repurchased October 1–26, leaving $4.9B per the earnings release). Class A shares outstanding fell to 866 million at September 30, 2026, from 887 million at December 31, 2025 — the buyback is shrinking the count, by about 2.4% in nine months.
- Dividend: $0.87 per share per quarter, declared at that rate through 2026 (the September 29, 2026 declaration, aggregate $758M, is payable November 9, 2026). Dividends paid in the nine months were $2,311M.
- Balance sheet (September 30, 2026): cash and equivalents $10,147M; total debt $23,938M (our calculation: short-term $1,749M + long-term $22,189M, up from $19,000M at December 31, 2025); total equity just $6,740M against total assets of $58,149M. The thin equity is not distress — it is the arithmetic of decades of repurchases at high prices — but it is why book-value-based ratios mislead here, and why the capital-efficiency discussion below works from cash flow and operating profit rather than from equity alone.
Capital efficiency: ROIC as a worked example, with its inputs on the table
Mastercard converts revenue to operating profit at a margin most industries never reach — 59.8% in Q3 2026 and 57.6% in fiscal 2025 — while spending very little on tangible capital. Any return-on-capital figure for such a business is extremely high and extremely sensitive to definition, so what follows is a worked sensitivity example, not a measured company ROIC: the inputs and the definition are printed, and two outcomes under two definitions are shown so the reader can see how much of the answer is the definition (the framework is in ROIC explained and ROIC vs ROE).
Fiscal 2025 inputs (Form 10-K, via the team's alignment table): operating income $18,897M; effective tax rate 19.4%, giving NOPAT of about $15,231M (our calculation). Invested capital, defined for this example as total debt + operating lease liabilities + total equity − cash and equivalents, was $17,013M at December 31, 2025 and $17,059M at December 31, 2024 — an average of $17,036M.
- Under that stated definition, the example's arithmetic gives about 89%.
- Change one assumption — do not deduct cash — and the same inputs give about 57%.
Neither figure is "Mastercard's ROIC": the company does not publish one, and the spread between the two outcomes is the point of the example. Three cautions apply before using either figure: cumulative buybacks have shrunk the equity inside the capital base; goodwill of $9,560M sits inside the asset base the equity and debt fund, and excluding it would raise the result further; and a ratio this high mostly certifies that the business needs little tangible capital — its real capital is the network, the brand and the acceptance footprint, none of which sits on the balance sheet. The method is the takeaway: state the definition first, then the number, and treat any single return-on-capital figure for this kind of business as definition-dependent.
Mastercard vs Visa vs American Express: three models, one industry
| Visa | Mastercard | American Express | |
|---|---|---|---|
| Runs the network | Yes | Yes | Yes |
| Signs up merchants (acquiring) | Merchant acquirers | Merchant acquirers | Amex itself, plus OptBlue acquirers |
| Issues the cards | Banks | Banks | Amex itself, plus GNS partner banks |
| Lends the money | Banks | Banks | Amex itself |
| Cardholder credit losses | Issuing banks | Issuing banks | Amex itself |
| Takes deposits | No | No | Yes |
| Revenue presentation | Four categories less client incentives | Two categories, net of rebates and incentives | Discount revenue, card fees, interest |
| Scale (latest full year) | Net revenue $45.903B, fiscal 2026 (ended Sep 30, 2026) | Net revenue $32.791B, fiscal 2025 (ended Dec 31, 2025) | Revenues net of interest expense $72.229B, fiscal 2025 |
| Free cash flow as published on this site | Simple FCF $22.057B (fiscal 2026; OCF − combined property, equipment and technology purchases) | FCF (b) $16.433B (fiscal 2025; OCF − PP&E − capitalized software) | Not presented as a headline on this site |
Visa and Mastercard are the same kind of business; the genuine differences are in the mix and the presentation. Mastercard's services layer is a reported category at 41% of its net revenue; Visa's services revenue is reported as a cross-cutting subtotal inside its categories, built on a different definition — so the two services figures describe different scopes and are not ranked against each other here. Mastercard reports its assessments in four streams, of which transaction processing is the largest; Visa separates international transaction revenue as a category of its own. Mastercard splits its capex into equipment and capitalized software, letting readers compute FCF on the stricter definition; Visa's combined line does not. And Mastercard is the smaller network by revenue — roughly seven-tenths of Visa's scale on the latest full years, with the fiscal-year offset noted in the table.
The table's "cardholder credit losses" row also needs its companion fact from the model section: at both networks, cardholder credit risk belongs to the issuing banks, while the networks themselves carry settlement-guarantee exposure toward their member institutions. The two risks are different in kind and sit with different parties.
Against American Express, the contrast is categorical rather than incremental: the networks earn tolls on other people's lending, while Amex stacks the toll, the membership fee and the lender's spread on the same transaction and owns the credit losses. Neither model is simply better; they fail in different ways, which is why this site reads their statements with different checklists. Our Visa analysis covers the network model from Visa's side. An American Express analysis on the same framework is in preparation and is not yet published.
Risks investors should not ignore
- Interchange regulation and litigation: Mastercard's fees and acceptance rules have been challenged for two decades. The Form 10-Q's legal proceedings note describes the U.S. merchant interchange litigation running since 2005, and the expense is not historical: litigation provisions were $156M in the first nine months of 2026 (against $330M a year earlier), accrued litigation stood at $262M at September 30, 2026, and Q3's provision was driven by settlements with merchants who opted out of the class settlement. Regulation of interchange, surcharging and acceptance practices in any major market can reset network economics directly.
- Settlement guarantee exposure: Mastercard guarantees settlement between its customers, and the Form 10-Q lists "exposure to loss or illiquidity due to our role as guarantor" among its risk factors. This is not cardholder lending risk: the exposure runs to member institutions' settlement obligations. It is a structural feature of the network model — the network's promise is what makes the four-party system work — and it belongs on the risk list separately from the issuers' credit risk.
- Incentive competition: rebates and incentives grew faster than net payment-network revenue in both the quarter and the nine months. If winning and renewing issuer portfolios keeps getting more expensive, volume growth will keep arriving with a smaller net toll attached.
- Customer concentration and renegotiation: a small number of large issuers and partners account for a large share of volume; contract renewals reprice the network's economics in steps, not smoothly.
- Alternative rails: account-to-account and real-time payment systems (often government-backed), wallets and stablecoins aim at the same transactions with different economics. The company's own strategy — including its 2026 acquisition spending ($1,372M net of cash acquired in the nine months) and the "Global Money Platform through BVNK" the CEO cited in the Q3 release — is partly a hedge against volume migrating off card rails.
- Volume cyclicality: Consumer spending, travel and cross-border e-commerce activity affect GDV, cross-border volume and related revenue.
- Currency: results are reported in U.S. dollars on global volume; in Q3 2026 the currency effect was roughly neutral, but the nine-month figures include a 2-percentage-point currency contribution to net revenue growth — reported growth and local-currency growth are not interchangeable.
- Valuation risk: a high-quality franchise can still be a poor investment at the wrong price — see the framework below.
A practical valuation framework
Rather than anchor on a single price target, value Mastercard on normalized cash flow and test the downside:
- Start from definition (b). Use FCF (b) — operating cash flow minus equipment purchases and capitalized software — as the cash earnings base, and check its conversion against net income over several periods (83% in the first nine months of 2026; 107% a year earlier; the swing was working capital, not profitability).
- Normalize the incentives line. Ask what net revenue growth looks like if rebates and incentives keep growing faster than gross network revenue, as they did in 2026, rather than assuming the current net take rate holds.
- Separate the engines. Value the payment network on volume-linked growth and the services layer on its own durability; a single blended growth rate hides the mix shift that is doing much of the work.
- Demand a margin of safety for the legal overhang. Litigation provisions recur and settlement cash arrives in lumps; compare the earnings and FCF yields on normalized figures with the company's own history and lower-risk alternatives, and require the downside case — slower volumes, richer incentives, further settlements — to still make sense. Our stock analysis framework provides the repeatable checklist.
Quarterly checklist for Mastercard shareholders
- Payment-network net revenue growth against rebates and incentives growth — is the gross-to-net bridge widening or narrowing?
- Value-added services growth and its share of net revenue (41% in Q3 2026).
- GDV, cross-border volume and switched transactions growth, each quoted with its basis (local currency vs U.S. dollar).
- Operating cash flow and FCF (b) on the cumulative periods the company actually publishes — and which working-capital lines moved them.
- Litigation provisions in the quarter and the accrued litigation balance.
- Repurchase dollars against the actual decline in shares outstanding, and the remaining authorization.
- Capitalized software against PP&E purchases — the split that defines FCF (b).
Bottom line
Mastercard is a toll road with a fast-growing services business built on top of it. Q3 2026 showed both halves working — net revenue up 14% to $9.807B, services at 41% of the total and growing 19%, operating margin at 59.8% — alongside the model's permanent negotiation: $6.369B of rebates and incentives, more than half the network's gross revenue, deducted before net revenue in a single quarter and growing faster than the net revenue it leaves behind.
For a disciplined investor, the debate is not whether this is a good business. It is whether normalized free cash flow — computed on the stricter definition, after through-cycle incentives and litigation costs — justifies the price, with a margin of safety for a legal and regulatory overhang that has already lasted twenty years.
Frequently asked questions
Is Mastercard a bank? No. Mastercard is a technology and network company. Banks and other financial institutions issue its cards, lend to cardholders, and hold the deposits; separate acquirers sign up merchants. Mastercard operates the network that connects the two sides and sets its rules — which is why it reports no loan book and no provisions against cardholder credit losses. The credit exposure it does carry is different in kind: it stands as guarantor of settlement between its customers, as its Form 10-Q's risk factors describe.
Why does this article show two free cash flow figures? Because Mastercard's cash flow statement separates what it spends on property and equipment ($667M in the first nine months of 2026) from the software it capitalizes ($474M). Definition (a) deducts only the first; definition (b) deducts both. The difference between the two definitions is the deduction for capitalized software; both are shown with their definitions labeled. Our explainer on free cash flow covers where each definition applies.
Why are Mastercard's rebates 52.6% while Visa's client incentives are 28.5%? They are shares of different denominators. Mastercard's 52.6% is rebates and incentives as a share of gross payment-network revenue in Q3 2026 (our calculation). Visa's 28.5% is client incentives as a share of total revenue before incentives in its fiscal 2026. The two ratios describe the same economic idea — the network deducts part of its gross pricing to win volume — but they cannot be ranked against each other without rebuilding both on one scope, which the filings do not fully allow.
Does Mastercard give earnings guidance? We did not identify a numeric outlook in the Q3 2026 earnings release and Form 10-Q reviewed for this article. This statement is limited to those documents; the article uses reported actuals and labeled calculations.
What is gross dollar volume (GDV)? The dollar value of activity on Mastercard-branded cards in the period — purchase volume plus cash volume (including balance transfers and convenience checks), as defined in the Form 10-Q's MD&A. GDV is an activity measure, not revenue: Mastercard earns assessments on a small fraction of it, and rebates and incentives then reduce those assessments to net revenue.
Primary sources
- Q3 2026 earnings release, Form 8-K Exhibit 99.1 (furnished October 29, 2026) — Mastercard IR (PDF). Used for: headline results and growth rates; adjusted (non-GAAP) results and reconciliations, including the Q3 EPS bridge components (p. 11: litigation provisions +$0.06 and (gains) losses on equity investments −$0.03 per share, net of tax) and the year-to-date special items (p. 12); return of capital (Q3 repurchases of 5.3M shares for $3.0B; dividends paid $763M; $4.9B remaining authorization after October repurchases); the 3.8 billion cards figure; operating performance tables (GDV $2,952B in Q3 2026 and $8,523B for the nine months, purchase transactions; pp. 13–14).
- Form 10-Q for the quarter ended September 30, 2026 (filed October 29, 2026; SEC accession 0001141391-26-000124) — SEC. Used for: income statement (Part I, Item 1, p. 6); balance sheet (p. 8 — cash, debt, equity, shares outstanding, accrued litigation); cash flow statement, nine months (p. 11 — including proceeds from debt of $5,596M and payments on debt of $618M); revenue by category and region (Note 3, p. 13); EPS components (Note 4); dividends declared of $0.87 per share and the repurchase authorization table (remaining $5,568M at September 30, 2026; 22.9M shares at an average $520.64 for the nine months) (Part II, MD&A, Liquidity and Capital Resources); key-driver definitions and growth (MD&A, p. 35); assessments key metrics (MD&A, p. 36); rebates and incentives of $6,369M (Q3) and $18,005M (nine months) (MD&A, Net Revenue discussion, p. 37); the guarantor risk wording (forward-looking statements, p. 3); interchange litigation (legal proceedings note).
- Form 10-K for the fiscal year ended December 31, 2025 (filed February 11, 2026; SEC accession 0001141391-26-000013) — SEC. Used for (via the team's 2026-10-26 alignment table, read directly from this filing): fiscal 2025 net revenue and its two categories (Note 3), operating income, operating cash flow, purchases of property and equipment, capitalized software, and the ROIC input balances (Consolidated Balance Sheets; Notes 8, 13, 18).
- Visa fiscal Q4 and full-year 2026 earnings release (October 27, 2026; SEC Exhibit 99.1) and Visa Form 10-K for fiscal 2025 (accession 0001403161-25-000089) — as published and summarized in our Visa analysis and the team's 2026-10-26 MA/Visa alignment table. Used for: the comparison table's Visa figures (fiscal 2026 net revenue, simple FCF and client incentives; fiscal 2025 value-added services subtotal and capex scope).
Disclosure: This article is for education and research only and is not individualized investment advice. Financial data can change; verify figures in the company's latest filings before making an investment decision.