
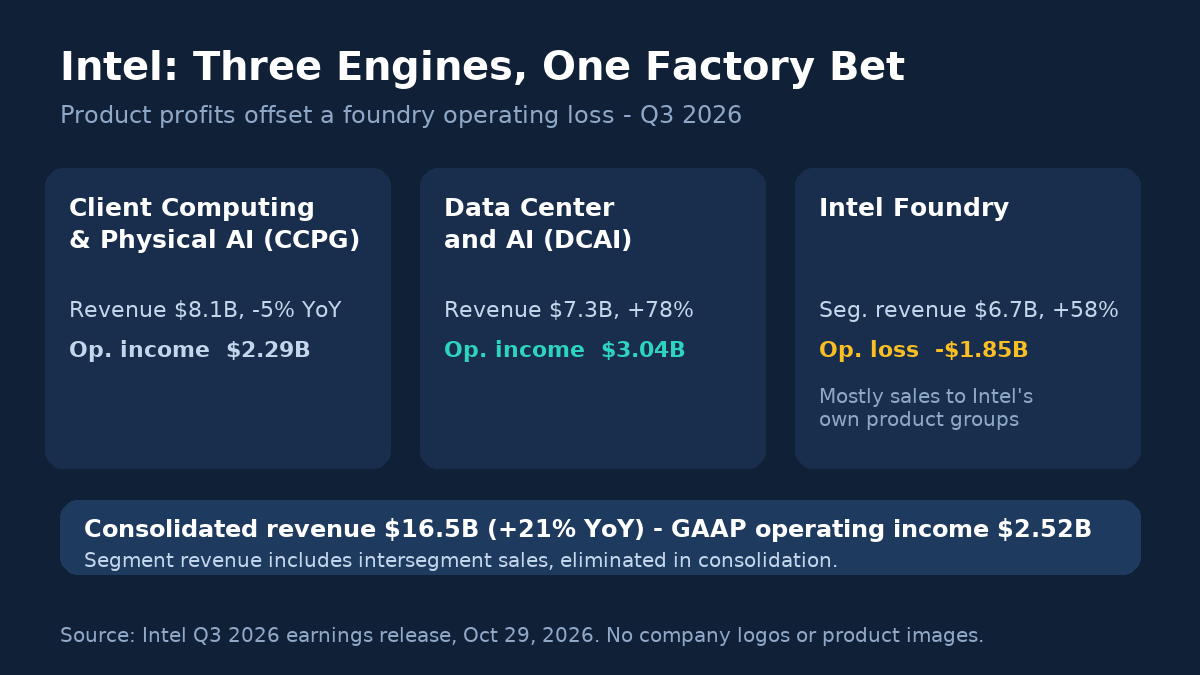
Intel’s third quarter of 2026 showed a sharp operating recovery led by server processors, while its fourth-quarter outlook points to a much weaker PC business. Data Center and AI revenue grew 78% year over year, while PC revenue contracted and Intel Foundry remained loss-making. This analysis separates those operating trends, the foundry’s internal and external sales, GAAP and non-GAAP earnings, and two different free-cash-flow definitions. The central question is whether improved product demand and manufacturing execution can earn adequate returns on the next round of capital spending.
Financial data: three months ended September 26, 2026. Company disclosures dated October 29, 2026; source and calculation checks completed October 30, 2026 UTC. Nine-month results and Q4 guidance are labeled separately.
The Thesis in One Minute
- The recovery is real, and it is concentrated. Q3 revenue was $16,513 million, up 21%; GAAP operating income rose to $2,522 million from $683 million. DCAI contributed $3,039 million of segment operating income, more than the consolidated total after foundry losses, corporate costs and consolidation adjustments.
- The PC outlook is deteriorating. CCPG revenue fell 5% to $8,097 million. For Q4, management forecasts a sequential decline of more than 20%, alongside mid-teens sequential DCAI growth. Intel expects PC weakness to persist at least through the first half of 2027. These are company forecasts.
- Foundry execution improved, but external scale remains limited. Its operating loss narrowed to $1,853 million from $2,321 million. External sales were $411 million, or 6.1% of segment revenue (SML calculation), with most of the year-over-year increase attributable to a non-recurring contract. Internal manufacturing also supports Intel Products, so external sales alone are an incomplete return-on-capital test.
- Read GAAP and non-GAAP as a pair. GAAP diluted EPS was $0.60; non-GAAP was $0.52. GAAP includes a $1,005 million non-cash mark-to-market gain tied to the U.S. government’s equity arrangement. Neither measure should be read without its adjustments.
- Cash flow depends on the funding structure. Intel’s adjusted free cash flow was $1,639 million. Operating cash flow minus gross capex gives $863 million (SML calculation). Net partner contributions, government capital incentives and finance-lease payments explain the difference.
What Intel Actually Makes
Intel reports three operating segments, plus an All Other category:
- Client Computing and Physical AI Group (CCPG) sells PC processors and related client and edge products. Previously called Client Computing Group (CCG), it remains Intel’s largest revenue segment.
- Data Center and AI (DCAI) sells Xeon server processors, purpose-built silicon and AI-related data-center products. CPUs host, orchestrate and complement accelerator workloads. DCAI revenue is not a separately disclosed AI-only revenue measure.
- Intel Foundry develops process and advanced packaging technologies and provides manufacturing services to Intel’s product groups and external customers. It includes Intel’s capital-intensive manufacturing operations and facilities with partnership financing.
- All Other includes non-reportable businesses such as Mobileye, IMS and startups. Altera was deconsolidated on September 12, 2025 after Intel sold 51%; the 2025 comparison includes its operations only through September 11, 2025.
Intel is an integrated device manufacturer (IDM), unlike the fabless designers in our NVIDIA, AMD and Broadcom comparison. Intel’s product groups compete with AMD’s CPUs, while its foundry competes for manufacturing customers and capital. Our semiconductor stocks guide explains why the business model should be classified before comparing margins and cash flow.
Latest Results: Q3 2026
Three months ended September 26, 2026; comparative quarter ended September 27, 2025. Intel uses a 52/53-week fiscal calendar. Sources: Q3 earnings release and Form 10-Q, statements of operations.
| Metric | 2026 GAAP | 2025 GAAP | 2026 non-GAAP |
|---|---|---|---|
| Net revenue | 16,513 | 13,653 | 16,513 |
| Gross profit | 7,096 | 5,218 | 7,284 |
| Gross margin | 43.0% | 38.2% | 44.1% |
| Operating income | 2,522 | 683 | 3,234 |
| Operating margin | 15.3% | 5.0% | 19.6% |
| Net income attributable to Intel | 3,320 | 4,063 | 2,756 |
| Diluted EPS attributable to Intel | $0.60 | $0.90 | $0.52 |
Operating income nearly quadrupled, yet GAAP net income attributable to Intel fell 18% and diluted EPS fell by a third. Three distinctions explain the comparison:
- The prior-year quarter included a large disposal gain below operating income. Note 5 of the 10-Q reports an Altera divestiture gain of $5,546 million. The earnings release removes $5,452 million of net divestiture gains in its non-GAAP bridge; that adjustment is not the exact Altera gain.
- This quarter’s GAAP includes a $1,005 million Escrowed Shares mark-to-market gain. Non-GAAP excludes it. This is the main reason GAAP EPS exceeds non-GAAP EPS this quarter, although the full bridge includes other adjustments and tax effects.
- More shares affect EPS, not the net-income decline. Basic weighted shares increased from 4,514 million to 5,244 million (+16.2%, SML calculation); diluted weighted shares rose from 4,531 million to 5,307 million. Financing and employee equity issuance affect the denominator. Intel also subtracts a $120 million gain related to contingent Escrowed Shares from the current quarter’s diluted-EPS numerator: ($3,320m − $120m) / 5,307m rounds to $0.60. Dividing reported Intel-attributable profit by diluted shares alone does not reproduce GAAP EPS.
Non-GAAP operating income adds $586 million of share-based compensation, $72 million of acquisition-related adjustments and $54 million of restructuring and other charges to GAAP operating income. Stock compensation remains an economic cost and source of potential dilution. The 16.2% basic-share increase also reflects financing transactions and should not be attributed solely to stock compensation.
Consolidated Q3 net income was $3,520 million, including $200 million attributable to non-controlling interests (NCI), leaving $3,320 million attributable to Intel. These are different earnings measures. Source: 10-Q, Notes 4–5.
The Segments: A Data-Center Quarter
Segment revenue includes intersegment transactions; eliminations are shown below. These company-defined results exclude share-based compensation, restructuring and certain acquisition costs and are not fully burdened standalone-company earnings. Source: 10-Q, Note 2.
On a narrow screen, scroll the segment table horizontally to see both years.
| Segment | Q3 2026 revenue | Q3 2026 operating income (loss) | Q3 2025 revenue | Q3 2025 operating income (loss) |
|---|---|---|---|---|
| CCPG | 8,097 | 2,285 | 8,535 | 2,694 |
| DCAI | 7,318 | 3,039 | 4,117 | 964 |
| Total Intel Products | 15,415 | 5,324 | 12,652 | 3,658 |
| Intel Foundry | 6,697 | (1,853) | 4,235 | (2,321) |
| All Other | 692 | 179 | 993 | 100 |
| Corporate unallocated | — | (1,058) | — | (782) |
| Intersegment eliminations | (6,291) | (70) | (4,227) | 28 |
| Total consolidated | 16,513 | 2,522 | 13,653 | 683 |
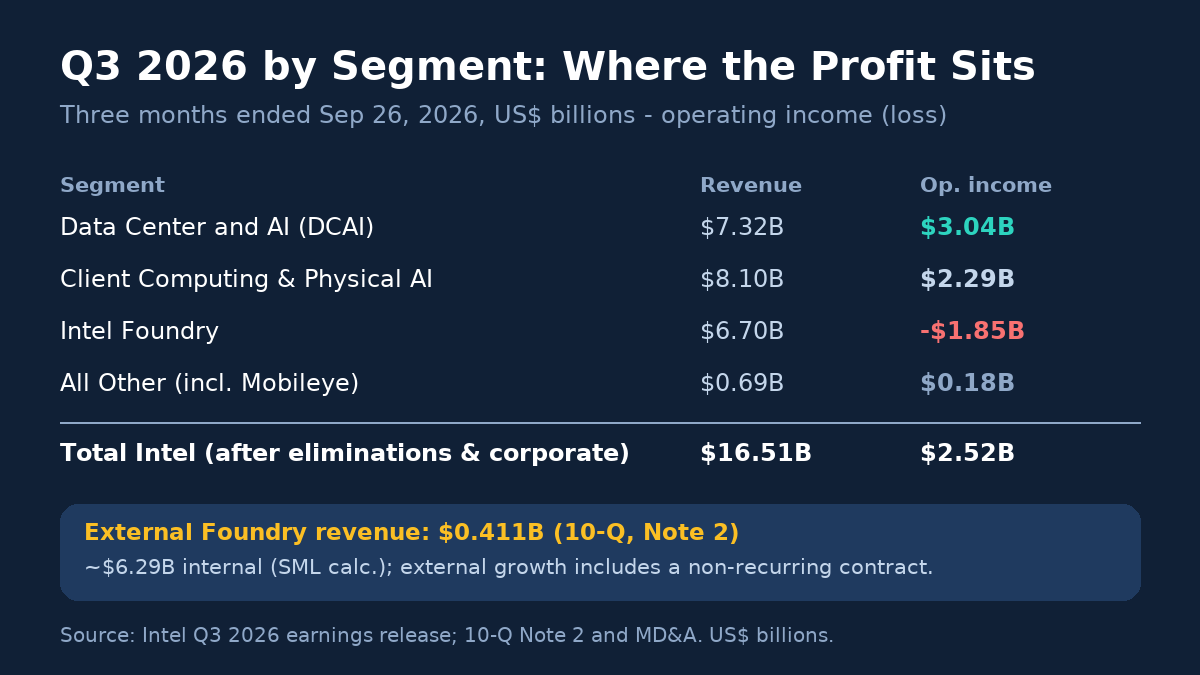
DCAI led the operating improvement. Its 41.5% segment operating margin is an SML calculation. The 10-Q attributes server growth to a higher premium-product mix, pricing and volumes; AI demand is management’s explanation, not a separately disclosed AI-only sales line. DCAI profit exceeded consolidated operating income, but CCPG also contributed $2,285 million.
CCPG faces a sharper near-term contraction. Q3 revenue fell 5% and segment operating income fell 15% (SML calculation). Higher memory costs, constrained IT budgets and customer inventory reductions weigh on the outlook. Memory pricing can help suppliers while raising PC system costs, but it does not establish the results of every memory company. See the SK hynix analysis for the supplier-side framework.
Intel Foundry: $6.7 Billion of Revenue, $0.4 Billion External
Segment revenue is not external demand. Internal manufacturing can create value through product cost, yield, supply and performance. External sales are an additional commercial test, not the only justification for the assets.
Foundry reported $6,697 million of segment revenue. Note 2 separately discloses $411 million from external customers, versus $32 million a year earlier. The remaining $6,286 million is SML arithmetic for internal activity. The $6,291 million consolidated revenue elimination is a different line and must not replace the foundry-only split. External sales represent 6.1% of segment revenue (SML calculation). 10-Q, Note 2 and Foundry MD&A.
The 10-Q attributes most of the year-over-year external increase to revenue under a non-recurring foundry contract. Prepared remarks identify a $118 million sequential increase, primarily due to a non-recurring customer program. The materials do not identify the customer or quantify the non-recurring component. Consequently, $411 million cannot reliably be annualized into recurring revenue.
The foundry operating loss narrowed by $468 million year over year (SML calculation). The 10-Q identifies lower period charges; management also cites better yields, cycle times and utilization. Intel reports 18A costs down approximately 40% since Q1 and an Intel 14A 0.9 design kit released in October. These are signs of execution progress, not proof of sustained profit or a committed external production win. Prepared remarks, pp.5–6.
Capex and Free Cash Flow: Who Pays for the Fabs?
Intel defines adjusted free cash flow as operating cash flow less gross property, plant and equipment additions, plus capital-related government incentive proceeds and net SCIP partner contributions, less finance-lease payments. SML also shows a simpler measure that excludes the funding and lease adjustments. Neither is a GAAP-defined FCF subtotal.
SCIP is Intel’s Semiconductor Co-Investment Program. Partners help fund factories while retaining economic claims. Total NCI is not synonymous with SCIP: September 26 balances were Arizona SCIP $14,372 million, Mobileye $2,129 million and IMS $141 million, totaling $16,642 million. Intel reacquired the Ireland SCIP minority interest in April 2026. 10-Q, Note 3.
| Component | Intel adjusted FCF | Simple FCF (SML) |
|---|---|---|
| Cash provided by operations | 5,082 | 5,082 |
| PP&E additions (gross capex) | (4,219) | (4,219) |
| Government capital incentives | 48 | — |
| Partner contributions, net | 847 | — |
| Finance-lease payments | (119) | — |
| Free cash flow | 1,639 | 863 |
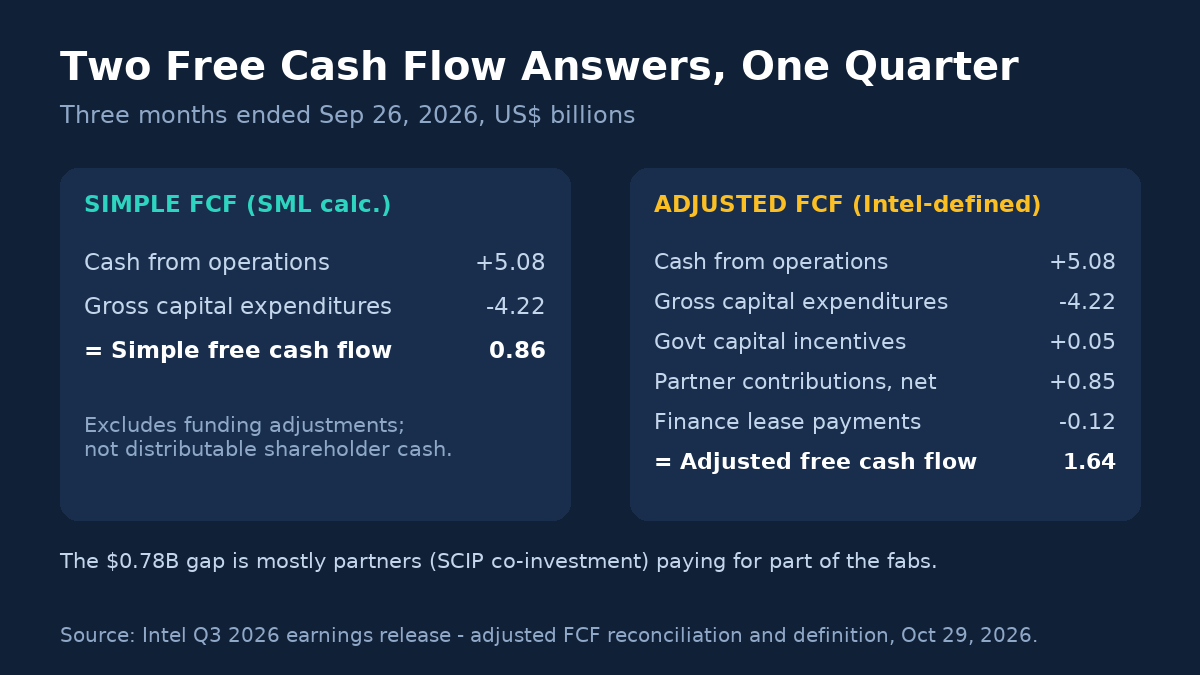
The $776 million bridge is $48 million + $847 million − $119 million. Partner contributions are financing support, not operating customer receipts, and partners retain economic claims. Simple FCF is also not complete distributable cash flow to Intel common holders: it omits acquisitions, minority-interest transactions and other financing needs. Use a consistent definition, then assess obligations separately. Our FCF guide and AI capex comparison explain why definitions matter.
For the nine months ended September 26, operating cash flow was $13,184 million. PP&E cash additions were $10,216 million in investing activities and $1,618 million in financing activities; these cash payments are not identical to a gross-capex outlook. Consolidated GAAP net loss was $11,609 million, versus an Intel-attributable loss of $11,441 million. The income statement reports $4,294 million of restructuring and other charges; the $3,969 million cash-flow adjustment is a different amount. Escrowed Shares produced a $12,614 million mark-to-market loss. Annualizing Q3 EPS ignores these period differences.
The Government Stake and the $23 Billion Equity Raise
- The U.S. government is a shareholder and counterparty. Under the Secure Enclave arrangement, escrowed shares are released as Intel performs and receives proceeds. The related derivative liability produced the Q3 $1,005 million non-cash gain and nine-month $12,614 million loss. Neither is operating performance.
- Intel raised equity at scale. Its August offering issued approximately 242 million shares for $23 billion gross and $22,617 million net proceeds. Shares outstanding at September 26 were 5,310 million, versus 4,994 million at December 27, 2025. Existing holders need to evaluate eventual returns per share.
- Liquidity was supported by financing. Cash and equivalents of $21,846 million plus short-term investments of $32,159 million totaled $54,005 million, against debt of $50,134 million. The difference is $3,871 million (SML calculation), before leases, other obligations and minority claims. It is not evidence of $23 billion in operating cash generation.
The 10-Q identifies the earlier SoftBank and NVIDIA investments as issuances of Intel shares. Investor purchases belong to financing, not gains on Intel’s investments in other companies. Note 5 separately reconciles Q3 interest income of $461 million, interest expense of $324 million, the $1,005 million Escrowed Shares gain and $12 million of other net expense to $1,130 million of interest and other income. 10-Q, Notes 4–5.
Outlook: Q4 2026 Guidance — Company Forecasts
These are company expectations as of October 29, not reported results. Gross margin and EPS use the midpoint of the revenue range. Source: release, Business Outlook.
| Metric | GAAP | Non-GAAP |
|---|---|---|
| Revenue | $15.0–16.0 billion | $15.0–16.0 billion |
| Gross margin | 37.1% | 38.0% |
| Tax rate | 31% | 11% |
| Diluted EPS attributable to Intel | $0.10 | $0.25 |
The guidance does not imply falling DCAI demand. Management expects mid-teens sequential DCAI growth and a greater-than-20% sequential CCPG decline. The outlook already includes estimated Fab 28 impacts of about $300 million in revenue and 200 basis points in non-GAAP gross margin. These must not be subtracted again. Management says almost all the revenue impact relates to 10nm server products. Lower client volume against a fixed-cost base and product mix also weigh on margins. Prepared remarks, pp.6–7.
Management maintained its 2026 gross-capex outlook of $20 billion and expects a strong increase in 2027. This is an investment plan, not a Q3 cash-spending figure. The 10-Q reports $19.6 billion in capex commitments, substantially most due within 12 months, plus additional substrate funding requirements after quarter-end. These reinforce the importance of cash conversion and financing. 10-Q, Note 14.
Risks
- Manufacturing execution and external demand are separate tests. Internal node costs, utilization and product competitiveness matter alongside repeat external wins. Comparing external sales alone with company-wide capex ignores Intel’s product business.
- Profit improvement is concentrated. DCAI drives growth while profitable CCPG faces a sharp near-term decline. CPU share loss to AMD or a server-spending pause would weaken the offset to foundry losses. See the AMD analysis.
- PC costs and inventory remain headwinds. Higher memory costs can restrain PC demand even while supporting memory suppliers’ pricing.
- Dilution precedes the hoped-for returns. Basic weighted shares rose 16.2% year over year. New capital must generate adequate product and manufacturing returns per share.
- Government involvement has several economic effects. Policy can change funding, obligations and transaction terms; Escrowed Shares also create non-cash profit volatility.
- Minority interests have different underlying agreements. Factory partnerships, Mobileye and IMS cannot be treated as one uniform debt-like senior claim. Analyze each subsidiary’s economics separately.
Valuation Framework Without a Live Price
This analysis uses no current share price and makes no claim that Intel is cheap or expensive.
- Value products and manufacturing separately. Intel Products earned $5,324 million of Q3 segment operating income, while Foundry lost $1,853 million. A consolidated multiple hides the difference.
- Test both internal and external manufacturing returns. Track yield, wafer cost, utilization and product competitiveness alongside recurring external customer revenue. The disclosed $411 million total does not reveal an independently measurable recurring base.
- Fix the FCF definition before comparing. Compare the simple and company measures consistently, then assess partner claims and commitments. Our ROIC guide explains the invested-capital questions. This analysis does not calculate ROIC from an assumed capital base.
- Work per share. Use a defensible forward diluted share count and issuance scenarios. Management expects approximately 5.44 billion diluted shares in Q4, including a full quarter of the August issuance. Aggregate profit growth and per-share value growth are different tests.
Reader Checklist
- Keep Q3 results, nine-month cash flows and Q4 guidance separate.
- Distinguish $6.7 billion of Foundry segment revenue from $411 million of external sales, including an unquantified non-recurring component.
- Identify the EPS basis and the numerator adjustment. The prior-year $5,546 million Altera gain differs from the $5,452 million net divestiture adjustment.
- Reconcile FCF to its definition and the $776 million funding-and-lease bridge.
- Assess debt, leases, minority interests and other commitments separately.
- Ask what internal process execution, product competitiveness and external demand must achieve for manufacturing capital to earn adequate returns.
FAQ
Is Intel Foundry’s $6.7 billion of revenue real?
It is segment revenue, mostly intersegment activity eliminated in consolidation. Note 2 discloses $411 million of external sales. Most of the year-over-year external increase came from a non-recurring contract. The consolidated $6,291 million revenue elimination is not a foundry-only internal-sales subtotal.
Why did net income fall when operating income nearly quadrupled?
Below-operating-line items changed sharply, including the prior-year $5,546 million Altera gain, Escrowed Shares valuations and tax. A larger share count does not reduce net income; it affects the separate EPS comparison.
Why is GAAP EPS higher than non-GAAP EPS?
GAAP includes a $1,005 million non-cash Escrowed Shares gain that non-GAAP excludes. The full bridge also adjusts stock compensation, investment gains, acquisitions, restructuring, divestitures, NCI and taxes. There is no rule that non-GAAP must be higher.
Why is adjusted FCF larger than simple FCF?
Intel adds government capital incentives and net partner contributions, and deducts finance-lease payments. Q3 adjusted FCF was $1,639 million versus $863 million for operating cash flow minus gross capex. The $776 million difference is $48 million + $847 million − $119 million. Partner funding brings economic claims; incentives have program conditions.
Is the PC business dying?
Q3 CCPG remained profitable, with $8,097 million of revenue and $2,285 million of operating income. However, management forecasts more than a 20% sequential revenue decline in Q4 and weakness at least through the first half of 2027. One profitable quarter does not establish long-term recovery.
Does Intel compete with TSMC or AMD?
Both, in different layers. Product groups compete for server and client sockets, while Foundry seeks manufacturing customers against TSMC and Samsung. That dual role makes Intel an IDM and warrants a different analytical framework from the fabless comparison.
Primary Sources and Methodology
- Intel Q3 2026 earnings release, October 29: GAAP/non-GAAP results and reconciliations, segment results, Q3 adjusted FCF and Q4 guidance.
- Intel Form 10-Q for the quarter ended September 26: segment definitions and external Foundry sales (Note 2), NCI (Note 3), EPS and equity issuance (Note 4), non-operating items (Note 5), restructuring (Note 6), commitments (Note 14) and MD&A.
- Intel 2025 Form 10-K, Note 1: fiscal-calendar definition.
- Intel CEO/CFO prepared remarks, October 29: company forecasts for DCAI/CCPG, Fab 28 impacts, manufacturing costs, capex and diluted shares.
SML calculations are labeled. Segment results exclude certain corporate costs. Simple FCF is not Intel’s adjusted FCF or a GAAP subtotal. No valuation multiple or investment recommendation is inferred from a single quarter. No live share price, closing return or consensus estimate is used.
This article is educational analysis of company disclosures published October 29 and reviewed October 30, 2026. It is not investment advice or a recommendation to buy or sell any security.