
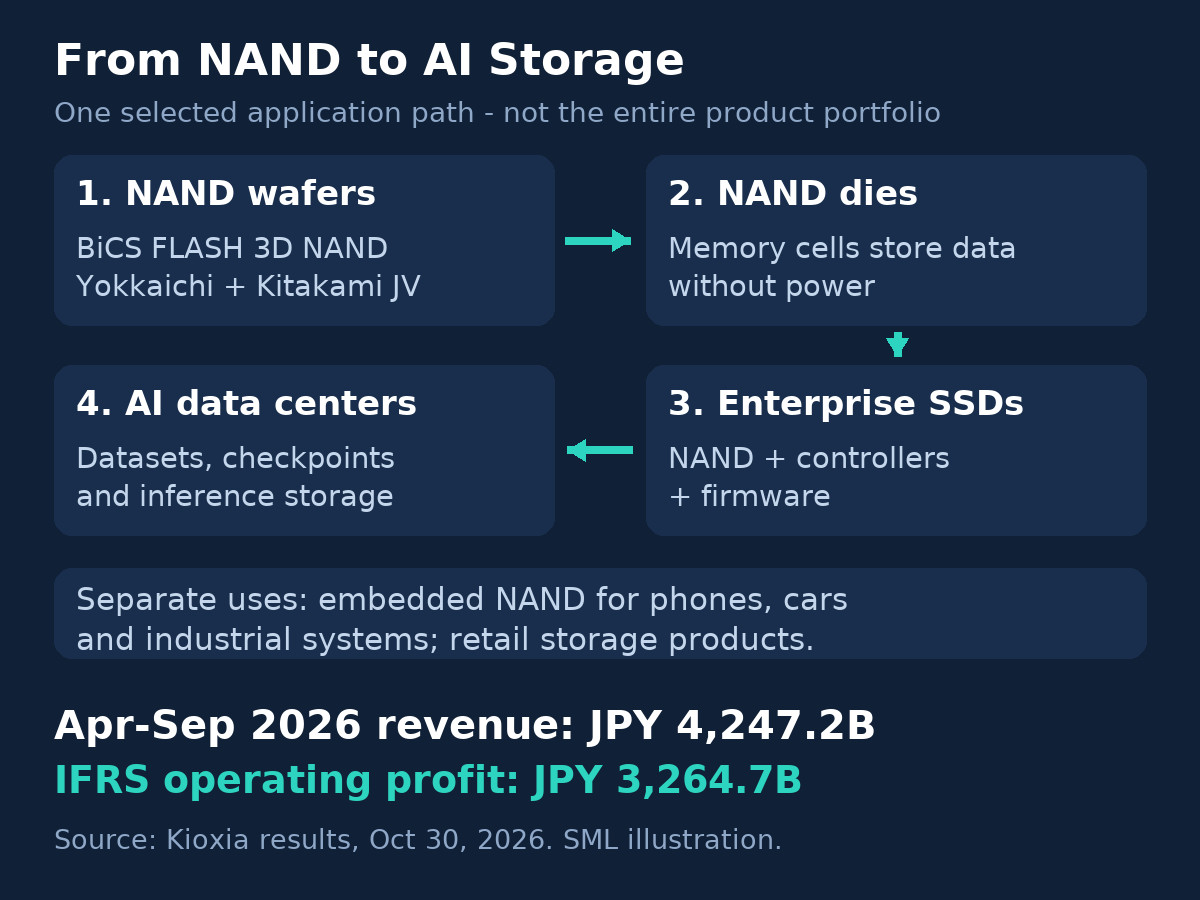
Every AI model has to put its data somewhere. Kioxia Holdings, listed on the Prime Market of the Tokyo Stock Exchange under code 285A, makes the NAND flash memory that stores it — and in the six months from April to September 2026, the AI storage boom produced numbers that would have been unthinkable a year earlier: revenue of ¥4,247.2 billion, up 436.8% year over year, and IFRS operating profit of ¥3,264.7 billion, a 76.9% operating margin.
Kioxia is a NAND-focused large-cap company in the AI supply chain: it sells storage, not compute, and not the high-bandwidth memory that feeds GPUs directly. That purity cuts both ways. NAND prices are among the most cyclical in semiconductors, and this company earned a 16.5% operating margin in the same six months a year ago. This analysis walks through what Kioxia actually sells, how price and volume combined to produce a record half, how the profit converted into cash, how the manufacturing partnership with SanDisk shapes its capacity, and what the first dividend and an ¥800 billion buyback say about where the cycle cash is going. It is education, not a recommendation.
A note on names and periods before we start: Kioxia’s fiscal year ends on March 31. Its English materials call the year ending March 31, 2027 “FY2026” (the year that begins in April 2026). Below, “the first half” always means April 1 to September 30, 2026, “Q2” alone means July 1 to September 30, 2026, and the company’s outlook for the December quarter is always labeled as an outlook.
The Thesis in One Minute
- Kioxia is a NAND flash pure play. It reports a single segment — the memory business — and everything it sells is built on NAND: enterprise and data-center SSDs, embedded memory for phones, cars and industrial systems, and retail storage products. It does not make DRAM or HBM. For the contrast, see SML’s SK hynix analysis, where the profit engine is stacked DRAM sitting next to AI accelerators.
- The half was a price-and-volume event. The company attributes the revenue surge to strong demand from data-center customers centered on generative AI, a large increase in average selling prices, higher bit shipments, and a weaker yen. Gross margin reached 80.8% (SML calculation) because fab costs do not rise with the price of a bit.
- The cash conversion is real — with a working-capital footnote. Operating cash flow was ¥2,379.6 billion in six months, and free cash flow on SML’s definition was ¥2,244.3 billion. But ¥1,014.4 billion of cash was absorbed by receivables that grew with sales, and ¥974.7 billion of income taxes sat accrued and unpaid at September 30 — a bill that will leave in a later period.
- The cycle cash is being handed back and deleveraged, by policy. In the same six months the company paid ¥800.3 billion buying back its own shares, repaid ¥523.1 billion of long-term loans, declared its first-ever dividend, and adopted a policy of returning 100% of medium- to long-term surplus funds to shareholders after funding investment and keeping a net cash position.
- The risks are the mirror image of the thesis. An 80% quarterly operating margin is a price phenomenon, and NAND prices have a long history of mean reversion. The company’s own outlook for the December quarter is for roughly flat profit versus Q2 — on strong demand, but a stronger yen assumption. What the market is pricing is not this half; it is how much of it survives the cycle.
What Kioxia Actually Makes
Kioxia’s technology is NAND flash memory — the non-volatile storage technology its predecessor business at Toshiba invented — manufactured as 3D NAND under the BiCS FLASH name at two Japanese campuses: Yokkaichi (Mie) and Kitakami (Iwate). The wafer fabs are run with SanDisk Corporation through three manufacturing joint-venture companies; Kioxia processes the wafers, and the joint operations’ output is shared between the Kioxia and SanDisk groups (the securities-report description is a 50/50 split of the joint operations’ output). Part of Kioxia’s own sales even flow back through that structure — see the “Other” category below.
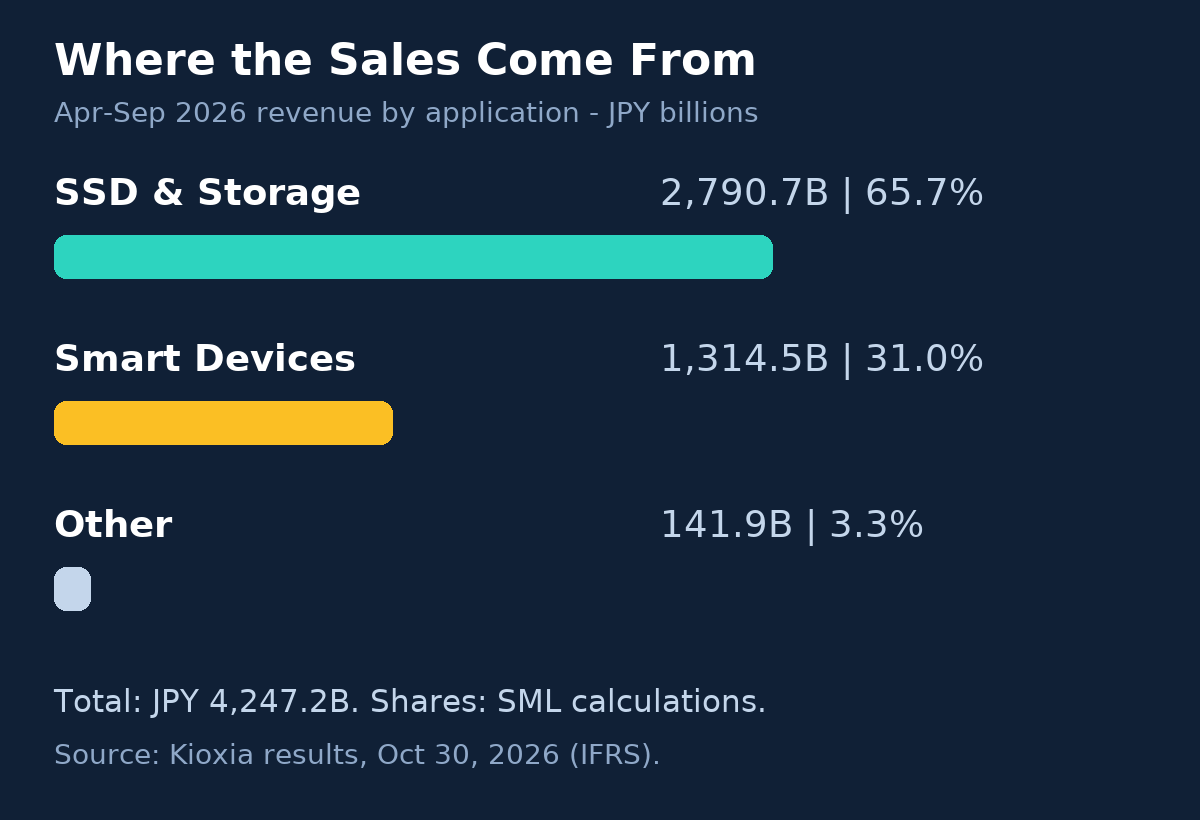
The company reports one segment, so there is no segment profit table. What it discloses is revenue by application:
Revenue by application — six months ended September 30, 2026 (as reported):
| Category | Revenue | Share* |
|---|---|---|
| SSD & Storage | ¥2,790.7B | 65.7% |
| Smart Devices | ¥1,314.5B | 31.0% |
| Other | ¥141.9B | 3.3% |
| Total revenue | ¥4,247.2B | 100% |
*Shares are SML calculations from the reported figures.
- SSD & Storage (¥2,790.7 billion) covers SSDs and memory products mainly for PCs, data centers and enterprise customers. This is where the AI demand is: the data-center and enterprise part of this category is the growth engine the company keeps pointing to.
- Smart Devices (¥1,314.5 billion) is embedded memory with control functions for smartphones, tablets and TVs, plus automotive and industrial uses. The release notes handset and PC demand was softening even as data-center demand expanded — yet this category still grew strongly in Q2 on price.
- Other (¥141.9 billion) includes retail products such as SD cards and USB memory, and sales to the SanDisk group booked through the three manufacturing joint-venture companies.
For the wider map of the chip supply chain, see SML’s AI Infrastructure Hub and the guide to how to analyze semiconductor stocks.
NAND Is Not HBM: The Distinction That Organizes the Memory Market
Because Kioxia and SK hynix are both “AI memory” stocks, they are often priced as if they were the same business. They are not, and the difference starts with physics:
- NAND flash (Kioxia) is storage. It keeps data when the power is off. It lives in SSDs, phones and servers’ storage tiers, and it is measured in bits shipped and price per bit. Its job is capacity: holding training datasets, model checkpoints, and the growing caches that AI inference systems read from. Demand grows with how much data the world wants to keep within fast reach.
- DRAM (SK hynix, Samsung, Micron) is working memory. It forgets everything when the power goes off, and its job is speed: feeding processors data at extremely low latency while they compute.
- HBM (high-bandwidth memory) is DRAM taken to an extreme — dies stacked vertically and wired with very wide interfaces, placed close to an AI accelerator to provide very high memory bandwidth. HBM is sold on bandwidth and qualification with specific accelerators, under long development cycles with individual customers.
The economics differ as much as the physics. HBM pricing is negotiated around accelerator programs and constrained by stacking and packaging capacity; NAND pricing is a commodity-like market price that can double — or halve — as industry supply and demand cross. Kioxia does not manufacture HBM or DRAM: its operating earnings are highly exposed to NAND prices, as the first-half results demonstrate. A price decline can reverse that operating leverage; share-price valuation need not move in lockstep with earnings. SK hynix, by contrast, mixes HBM and conventional DRAM with its own NAND and enterprise SSD business — and, as SML’s SK hynix analysis records, it also holds an investment stake in Kioxia itself, large enough that part of SK hynix’s October 2026 special dividend was explicitly linked to gains on that stake. The two companies are simultaneously peers, complements in the AI stack, and financial counterparties.
Latest Results: A Record First Half
Results — six months ended September 30, 2026 (IFRS, consolidated), released October 30, 2026:
| Metric | H1, year ending Mar 2027 | H1, year ended Mar 2026 | Change |
|---|---|---|---|
| Revenue | ¥4,247.2B | ¥791.1B | +436.8% |
| Gross profit | ¥3,433.2B | ¥193.3B | — |
| Gross margin | 80.8% | 24.4% | +56.4 pts |
| Operating profit (IFRS) | ¥3,264.7B | ¥130.8B | — |
| Operating margin (IFRS) | 76.9% | 16.5% | +60.3 pts |
| Non-GAAP operating profit* | ¥3,314.5B | ¥132.4B | — |
| Profit before tax | ¥3,203.4B | ¥84.0B | — |
| Profit attributable to owners of the parent | ¥2,197.9B | ¥58.9B | — |
| Non-GAAP profit attributable* | ¥2,235.6B | ¥60.2B | — |
| Basic EPS (split-adjusted) | ¥1,349.33 | ¥36.42 | — |
| Diluted EPS (split-adjusted) | ¥1,337.97 | ¥36.13 | — |
Margins are SML calculations. *Kioxia’s Non-GAAP measures exclude PPA (purchase price allocation) effects, stock-compensation cost and litigation-loss provisions, as defined by the company; they are management’s internal measures, not IFRS line items, and have not been audited or reviewed. The H1 bridge from IFRS to Non-GAAP operating profit is small relative to the totals: PPA effects of −¥0.2B, stock compensation of −¥13.0B and a litigation-loss provision of −¥36.6B separate the two.
The second quarter alone — three months ended September 30, 2026 (from the release’s quarterly income statement):
| Metric | Q2, year ending Mar 2027 | Q1, year ending Mar 2027 |
|---|---|---|
| Revenue | ¥2,480.0B | ¥1,767.1B |
| Gross margin | 82.8% | 78.1% |
| Operating profit (IFRS) | ¥1,994.7B | ¥1,270.0B |
| Operating margin (IFRS) | 80.4% | 71.9% |
| Non-GAAP operating profit | ¥1,988.3B | ¥1,326.2B |
| Profit attributable to owners of the parent | ¥1,355.7B | ¥842.2B |
| Basic EPS (split-adjusted) | ¥838.31 | ¥513.30 |
Margins are SML calculations. One definitional wrinkle worth teaching: in Q2 the Non-GAAP operating profit is slightly BELOW the IFRS figure, because the quarter’s stock-compensation line was a ¥6.4B reversal (a credit) that the Non-GAAP measure strips out. “Adjusted” does not always mean “higher.”
Three reading notes keep these figures honest:
- Scale check. Revenue in this single half (¥4,247.2 billion) is 1.8 times the company’s revenue for the entire previous fiscal year (¥2,337.6 billion, year ended March 2026, when operating profit was ¥870.4 billion). Q2 alone exceeded that full year on every headline line. This is what a commodity price spike does to a fixed-cost manufacturer.
- The profit is operating profit. Finance costs of ¥68.8 billion and a heavy tax charge (¥1,005.5 billion, an effective rate of about 31% on pre-tax profit) sit below the operating line, but nothing exotic inflates it: gross profit of ¥3,433.2 billion on revenue of ¥4,247.2 billion is the story, and it is a price story.
- Profit quality items are disclosed, and they are modest at this scale. The half’s IFRS operating profit absorbs a ¥36.6 billion litigation-loss provision and ¥13.0 billion of stock compensation (both visible in the Non-GAAP bridge above), plus a special profit distribution to employees that the release names as a profit-reducing factor without quantifying it in the summary. None of these changes the headline conclusion; all of them belong in a careful reader’s notes.
Outlook — not results. Kioxia does not publish a full-year forecast; the release states that annual plan figures are omitted because the memory industry’s environment can change over short periods. What it published on October 30, 2026 is an outlook for the third quarter alone (October 1 – December 31, 2026):
Metric (Q3 outlook) Company outlook Revenue ¥2,500.0B (+0.8% vs Q2) Operating profit (IFRS) ¥1,995.0B (+0.0% vs Q2) Non-GAAP operating profit ¥2,000.0B (+0.6% vs Q2) Profit attributable to owners of the parent ¥1,360.0B (+0.3% vs Q2) Basic EPS (split-adjusted) ¥851.11 Assumed USD/JPY ¥157 (Q2 actual average: ¥161) The company’s own framing: data-center demand is expected to remain strong, but the outlook assumes a worse exchange rate, so profit is guided roughly flat versus Q2. Read that carefully — after two quarters of explosive sequential growth, management’s own next-quarter number is a plateau, not another leg up. That is an outlook, not a result; judge it when the December-quarter figures arrive.
The Price-and-Volume Cycle: How a Record Half Happens
Kioxia’s own explanation of the first half, in its release, has three moving parts, and the order matters:
- Average selling prices rose sharply. Data-center customers — generative AI first — bid for NAND capacity, and the price of a bit climbed steeply through both quarters. This is the dominant factor: revenue rose 436.8% year over year in the half, and no plausible volume change explains that on its own.
- Bit shipments rose. The company also shipped more capacity (measured in bits), so volume compounded price rather than offsetting it.
- The yen helped. The average rate in the half was ¥160 to the dollar versus ¥146 a year earlier (¥161 in Q2 alone), inflating yen-reported results.
The industry frame from SML’s semiconductor stocks guide is exactly built for this: in memory, separate the product (NAND here, not DRAM), then read bit shipments and ASP as two different dials — volume is a share-and-demand story, price is a cycle story. Kioxia’s release confirms both dials turned up; it does not publish the percentage split between them in the summary financial statements, and this article does not invent one.
Two structural features of this cycle deserve a reader’s attention rather than a headline’s excitement. First, NAND supply responds slowly: new capacity means new fab shells and equipment years ahead, and the joint Kioxia–SanDisk build-out (next sections) is measured in trillions of yen over the rest of the decade. Second, the customer side has changed character: the release describes strong data-center demand tied to AI capital spending, the same spending tracked in SML’s AI capex comparison — rather than the phone-and-PC cycle that historically set NAND prices. Whether that makes this cycle shallower on the way down is the open question the valuation section returns to; the release itself offers the demand description, not a promise.
Capex, Depreciation and Free Cash Flow
Cash flow — six months ended September 30, 2026 (as reported, IFRS):
| Metric | H1, year ending Mar 2027 |
|---|---|
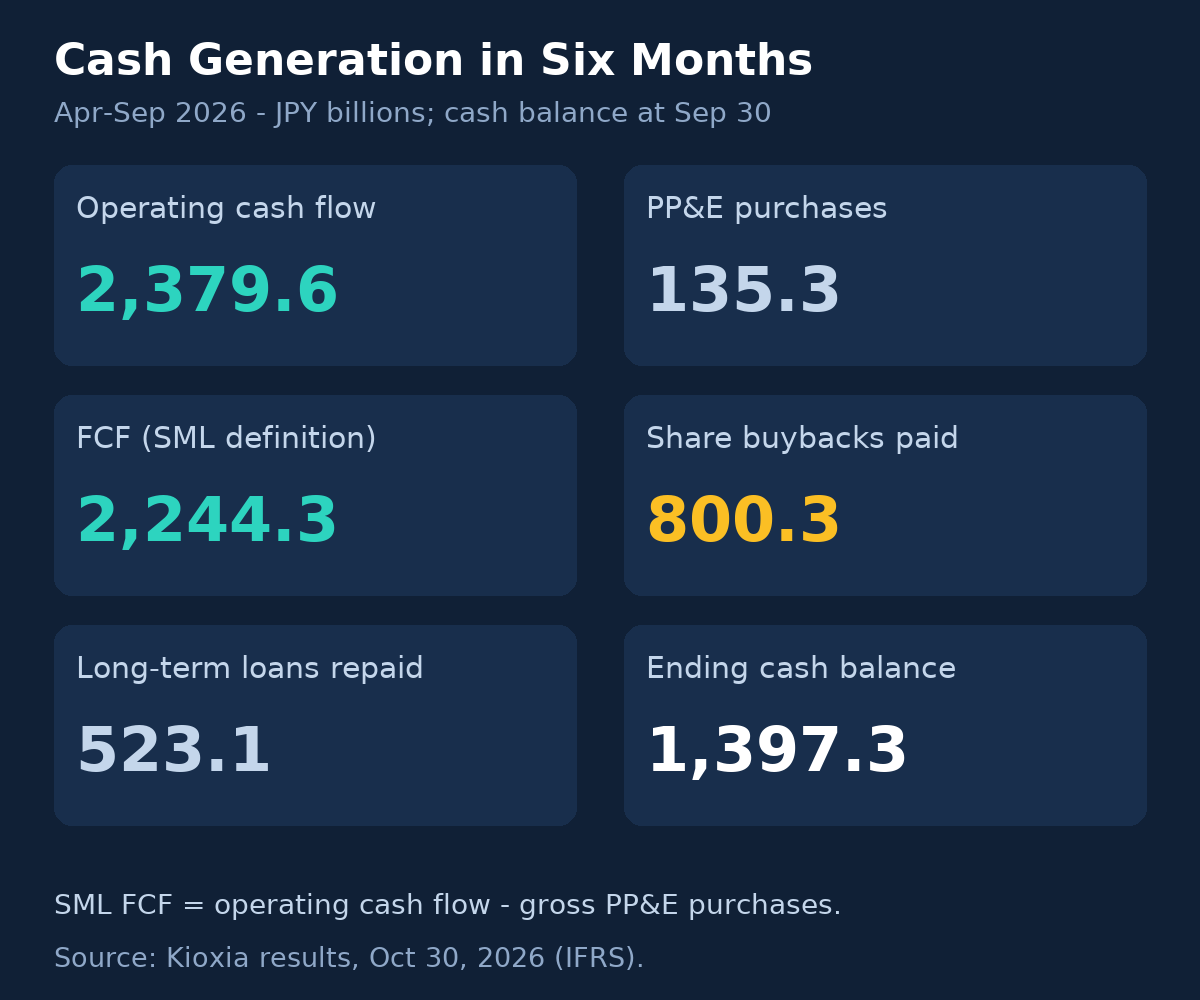
| Operating cash flow | ¥2,379.6B |
| Purchases of property, plant and equipment | −¥135.3B |
| Proceeds from sales of PP&E | +¥1.3B |
| Government subsidies received | +¥21.3B |
| Purchases of other financial assets (incl. shares of Nanya Technology) | −¥78.2B |
| Investing cash flow | −¥193.0B |
| Free cash flow (SML definition: operating CF − PP&E purchases) | ¥2,244.3B |
| Operating cash flow + investing cash flow (arithmetic sum — not a company measure) | ¥2,186.6B |
Operating cash flow absorbed a ¥1,014.4B increase in trade and other receivables and ¥33.9B of inventory build, and paid ¥110.7B of income taxes in cash. Depreciation and amortization in the half was ¥153.5B.
The teachable points:
- NAND fabs are capital-hungry, but a price spike outruns the capex bill. Six months of equipment purchases (¥135.3 billion) barely dents operating cash flow of ¥2,379.6 billion. That gap is the cycle, not a permanent cost structure: depreciation of ¥153.5 billion in the same half is the accounting echo of past capacity spending, and the joint investment program with SanDisk (below) points to much heavier spending ahead. SML’s free cash flow explainer shows the definition used here; the pattern to recognize is drill-down discipline — the same PP&E-purchases line, period after period.
- Keep cash-flow definitions separate. The FCF above is an SML calculation from the statutory cash-flow statement, not a company-reported FCF measure. It deducts gross PP&E purchases only; it does not deduct intangible-asset purchases or Nanya shares and does not add PP&E-sale proceeds or subsidies. Any company-defined measure should be compared only after its definition and reconciliation have been checked, as illustrated in the Advantest analysis.
- Watch the accrued tax. Income taxes payable on the September 30 balance sheet were ¥974.7 billion (versus ¥104.5 billion at March 31), while cash taxes paid in the half were only ¥110.7 billion. A large part of this half’s cash is therefore already spoken for: the tax on this profit will be paid in coming periods. Operating cash flow quality checks should net that timing difference mentally.
- A strategic supply-chain investment: the release identifies the ¥78.2 billion purchase of other financial assets with shares in Nanya Technology Corporation, the Taiwanese DRAM maker. Kioxia’s March 25, 2026 announcement explains the purpose: an equity subscription alongside a long-term DRAM supply agreement, intended to secure a key component for its growing SSD business. Buying DRAM for SSDs does not make Kioxia a DRAM manufacturer. The share purchase is excluded from the simple SML FCF above but remains a real use of cash.
The SanDisk Joint Venture and the Competitive Field
Kioxia does not manufacture alone. Its two campuses are run through three manufacturing joint-venture companies with SanDisk Corporation (NASDAQ: SNDK) — the Flash Alliance structure — under which the partners jointly fund and equip the fabs and share the output. Two recent company announcements define the partnership’s future:
- Term extension (January 2026). The Yokkaichi Plant joint-venture agreements were extended by five years, from December 31, 2029 to December 31, 2034; the Kitakami Plant agreements already run to the same date. As part of the extension, SanDisk will pay Kioxia US$1.165 billion in installments over 2026–2029 for manufacturing services and the continued supply relationship. The release puts the partnership’s history at more than 25 years of joint development and wafer production.
- Japan investment plan (August 27, 2026). Kioxia and SanDisk announced plans to invest approximately ¥5 trillion (over US$31 billion) in Japan by 2032 — production equipment, infrastructure and technology upgrades at Yokkaichi and Kitakami — premised on Japanese government support. The same release notes roughly ¥9 trillion invested over the past 25 years. Treat the ¥5 trillion as a plan with a stated government-support premise, not as committed capex in a forecast.
The structure matters for reading the financials. The manufacturing companies are accounted for as joint operations: Kioxia recognizes the assets, liabilities, income and expenses attributable to its interests. Kioxia’s statutory PP&E cash spending should therefore not be treated as the entire partnership’s investment, or assumed to exclude its own share of joint-operation spending. “Other” revenue includes sales to the SanDisk group through those companies.
Kioxia and SanDisk are NAND-focused competitors as well as manufacturing partners. Samsung Electronics, Micron Technology and SK hynix also have DRAM and HBM businesses, giving those three broader memory-product exposure. SanDisk should not be grouped with them as a DRAM manufacturer: like Kioxia, it buys DRAM components for SSDs. Diversification can change cycle exposure, but it does not guarantee that DRAM profits will offset a NAND downturn. This article carries no research-firm market-share estimates.
Shareholder Returns: ¥800 Billion of Buybacks, a First Dividend, and a Stated Policy
The distribution story in this half is as unusual as the profit story:
- Buyback, executed in eight days. On July 31, 2026 the board authorized repurchases of up to 30 million shares for up to ¥800 billion between August 3 and October 30, 2026 (figures here are pre-split share counts). The completion notice of August 10, 2026 records 16,133,500 shares repurchased for ¥799,997,689 thousand — effectively the full ¥800 billion — by August 10. The cash-flow statement confirms ¥800.3 billion of treasury-share purchase outflows in the half. After the October 1 split, the treasury position stands at 48,402,168 shares.
- First dividend in the company’s history. An interim dividend of ¥90 per share (pre-split basis; ¥30 per share after the split), totaling ¥47,937 million, with a September 30, 2026 record date and a payment (effective) date of December 8, 2026. The notice itself is captioned “interim dividends and first dividends.”
- A formal return policy (October 30, 2026). After funding capital expenditure, R&D, human-capital investment, strategic investment (including M&A) and other committed future spending — and while maintaining a net cash position — the basic policy is to allocate 100% of medium- to long-term surplus funds to shareholder returns, through flexible buybacks and progressive dividends. Read precisely: it is a policy for surplus funds over a medium-to-long-term horizon, not a payout-ratio promise on any single year’s profit.
- Deleveraging in parallel. Long-term loan repayments in the half were ¥523.1 billion (including early repayments), against ¥77.5 billion of new long-term borrowings. Total bonds and borrowings fell to ¥603.9 billion at September 30, while cash and equivalents rose to ¥1,397.3 billion — ¥793.4 billion more cash than bonds and borrowings (SML calculation; lease liabilities of ¥198.8 billion are additional obligations). The equity ratio rose from 37.9% to 49.8% in six months. A company that entered the cycle with a leveraged balance sheet has used one exceptionally profitable half to invert it — the fact pattern behind the “net cash position” language in the return policy.
Listing note — read this carefully before looking for a U.S. ticker. Kioxia Holdings is listed on the Prime Market of the Tokyo Stock Exchange, code 285A (the trailing “A” is part of the newer alphanumeric code format, not a share class). A 3-for-1 stock split took effect on October 1, 2026; per-share figures in this article are split-adjusted unless labeled pre-split.
In the United States, the OTC line KXIAY is an unsponsored ADR program: depositary-bank notices (Citibank, September 9, 2026) classify it as an “Unsponsored ADR Program” on the OTC market, CUSIP 49726J108, at a ratio of 10 ADRs to 1 ordinary share, and the split adjustment was applied to the ADR line as well. “Unsponsored” means depositary banks established the program without the company’s sponsorship — the receipts are issued by depositary banks, and this OTC program does not make Kioxia a U.S. exchange-listed company.
Separately — and this is a different thing — the company itself announced on May 15, 2026 that it is preparing to list American Depositary Shares representing its common shares on a U.S. stock exchange, to grow its investor base and increase corporate value. The announcement is explicit about what is not decided: the listing is contingent on approvals from the relevant authorities; the schedule, the listing market and the listing method have not been decided; and the company may decide not to continue pursuing the listing depending on circumstances during preparation. A follow-up notice on September 15, 2026 states that media reports about the listing are not company announcements and repeats the same caveats. Any figures about the size of a future offering or its timing that you see in news coverage are therefore reporting and speculation, not company disclosure. Do not confuse the unsponsored OTC line that exists today with the sponsored exchange listing the company is only preparing.
Risks
- Price reversal is the whole risk section in one line — and it is not hypothetical. A year earlier, the same business earned a 16.5% operating margin; two years of NAND history include outright industry losses. A material part of the current margin depends on favorable ASPs, alongside shipment volume, product mix and costs. The company’s flat Q3 outlook on strong demand, driven by an FX assumption, shows how quickly the tailwinds can offset.
- Working capital will swing with the cycle. Receivables absorbed ¥1,014.4 billion of cash in six months because sales quintupled; in a downturn the same line reverses, flattering cash flow while profit collapses — the mirror-image trap readers should pre-commit to recognizing.
- The accrued tax bill. ¥974.7 billion of income taxes payable at September 30 will be cash out the door in later periods, mechanically reducing future operating cash flow relative to future profit.
- Capital intensity is deferred, not abolished. The ¥5 trillion joint investment plan through 2032 (with its government-support premise) makes a multi-year investment comparison essential; this six-month cash-purchases figure alone does not establish a normal spending run rate. SML’s standing discipline is to judge memory makers on through-cycle free cash flow — the explainer on free cash flow and the ROIC guide give the framework; mechanically annualizing one exceptionally profitable half can overstate sustainable earnings.
- Partner and structure concentration. Manufacturing depends on the SanDisk joint ventures at two Japanese campuses; the partner is also a competitor, and the extension to 2034 plus the US$1.165 billion payment schedule concentrate a long horizon on one relationship.
- End-market exposure. The company attributes growth to strong data-center demand. SSD & Storage accounts for 65.7% of revenue, but also includes PC-related products; it is not a disclosed data-center-only share. The release does not provide a customer-concentration breakdown in these application tables. Softer consumer demand and any pause in AI infrastructure investment are risks to examine separately.
- Listing-related confusion. The unsponsored OTC ADR and the announced-but-undecided ADS listing preparation create real scope for investor misunderstanding; the company’s September 2026 notice exists precisely because reporting outran disclosure. A 3-for-1 split in the same season adds per-share confusion for anyone comparing figures across the October 1 boundary without checking the basis.
Valuation Framework (Without a Live Price)
This analysis uses no current share price, so it cannot tell you a P/E — by design. What it can do is fix the inputs a reader should carry to a live quote:
- Per-share earnings, split-adjusted: basic EPS of ¥1,349.33 for the first half and ¥838.31 for Q2 alone. The company’s own Q3 outlook implies ¥851.11 for the December quarter. Doubling the half gives approximately ¥2,700 by simple arithmetic; treating that as a full-year earnings forecast assumes similarly favorable conditions persist. It is not company guidance.
- Normalize against the company’s own history. The full prior fiscal year (ended March 2026) produced revenue of ¥2,337.6 billion and operating profit of ¥870.4 billion. The year before the spike, the first half’s operating margin was 16.5%. Any multiple should be tested against mid-cycle earnings, not against this half alone — and the honest mid-cycle anchor for NAND has historically been far below an 80% margin.
- Balance-sheet adjustment. At September 30 the company held ¥793.4 billion more cash than bonds and borrowings (SML calculation), a 49.8% equity ratio, and a stated policy of returning 100% of surplus funds over time. Enterprise-value thinking should at least register that the leverage discount investors applied to Kioxia at its 2024 listing has been substantially unwound by the company itself.
- What would change the picture: two or three more quarters of ASP discipline as new industry capacity lands; the conversion of the accrued tax and receivables balances; evidence on whether data-center NAND demand is contract-like (multi-year agreements) or spot-like; and any formal decision on the U.S. ADS listing, which would change the investor base and disclosure regime.
Reader Checklist
- Separate the company’s three clocks: the six-month actuals, the standalone Q2 actuals, and the Q3 outlook — keep them in different tables when comparing performance.
- When you see “operating profit ¥3,314.5 billion” quoted, check whether it is the Non-GAAP figure; the IFRS figure is ¥3,264.7 billion, and the ¥49.8 billion gap is litigation provision, stock compensation and PPA effects.
- Confirm the FCF definition in any commentary you read: statutory OCF minus gross PP&E purchases gives the SML-calculated ¥2,244.3 billion for the half. Do not compare it with another FCF figure without checking the reconciliation.
- The ¥1,014.4 billion receivables build is already deducted in reported operating cash flow; do not deduct it twice. Separately, ¥974.7 billion of income taxes payable at September 30 represents future cash payments, not an additional deduction in the reported half-year FCF calculation.
- Check every per-share number’s split basis (record date September 30, 2026; effective October 1). The ¥90 interim dividend is the pre-split amount; ¥30 is the post-split equivalent.
- If a U.S. quote is involved, verify whether you are looking at the unsponsored OTC ADR (KXIAY) or at news about the company’s separate, undecided ADS listing preparation.
- Ask what has to be true about NAND prices in 2027–2028 for today’s price to make sense — and what the 16.5% operating margin in April–September 2025 implies if it is not.
FAQ
Is Kioxia the “Japanese SK hynix”?
Only in the loose sense that both are memory makers riding AI demand. SK hynix’s profit engine is DRAM and HBM — working memory beside accelerators — with NAND as a second business. Kioxia is NAND only: storage. The cycle exposure, pricing mechanics and customer logic differ, which is why SML analyzes them separately and cross-links the pair.
Why is Kioxia’s operating margin higher than most software companies’ right now?
Because NAND prices spiked while its fab cost base is largely fixed in the short run: depreciation, labor and materials do not scale with the market price of a bit. Gross margin of 80.8% (SML calculation) shows how strongly a manufacturer can benefit from unusually favorable pricing. It does not establish when the cycle will peak. The same structure produced a 16.5% operating margin a year earlier; the margin is the cycle gauge.
What is the difference between Kioxia’s Non-GAAP profit and its IFRS profit?
The Non-GAAP measures exclude PPA (purchase price allocation) effects, stock-compensation cost and litigation-loss provisions, as the company defines them. For the first half they add back a net ¥49.8 billion to IFRS operating profit; in Q2 alone they actually sit slightly below IFRS, because that quarter’s stock compensation was a reversal. Always check which basis a headline uses.
Does Kioxia pay a dividend?
It has just declared its first one: an interim dividend of ¥90 per share on the pre-split basis (¥30 post-split), totaling ¥47,937 million, payable December 8, 2026, under a new policy of returning 100% of medium- to long-term surplus funds — after investment needs and while maintaining a net cash position — via buybacks and progressive dividends.
What exactly is KXIAY?
An unsponsored ADR trading over the counter in the U.S., at 10 ADRs per ordinary share, per depositary-bank notices (CUSIP 49726J108). It was set up by depositary banks without Kioxia’s sponsorship. It is not the U.S. exchange listing of ADSs that Kioxia announced on May 15, 2026 it is preparing — a process the company says may not proceed, with no market, method or schedule decided.
Does Kioxia compete with SanDisk or partner with it?
Both. They jointly fund and run the Yokkaichi and Kitakami wafer operations through three manufacturing joint-venture companies (the Yokkaichi agreements were extended to December 31, 2034, matching Kitakami’s existing term, with SanDisk paying Kioxia US$1.165 billion over 2026–2029 for manufacturing services and continued supply), and they compete in the market for NAND products and SSDs.
Primary Sources and Methodology
- Kioxia H1 earnings release, October 30, 2026 (Japanese, IFRS consolidated): first-half and standalone Q2 results, application revenue, statutory cash flows, balance sheet, split-adjusted EPS and Q3 outlook. The Japanese release is the controlling text used here.
- Shareholder-return policy and first interim dividend, October 30, 2026.
- Share-repurchase completion, August 10, 2026: repurchase share count, execution value and completion period.
- Annual Securities Report for the year ended March 2026: prior-year figures and joint-operation accounting and output-sharing structure.
- Yokkaichi joint-venture extension, January 30, 2026 Japanese disclosure, and Japan investment plan, August 27, 2026.
- Nanya equity subscription and long-term DRAM supply agreement, March 25, 2026.
- U.S. ADS exchange-listing preparation, May 15, 2026, and September 15 clarification: the listing schedule, market and method remain undecided, and the listing may not proceed.
- Citibank KXIAY notice, September 9, 2026, and Citi dividend history dated October 23, 2026: unsponsored OTC program, ratio and 200% stock distribution.
- SK hynix October 28, 2026 results announcement: declared special dividend linked to Kioxia investment gains. Sandisk FY2026 Form 10-K: NAND-focused business and externally sourced DRAM components.
- Methodology: SML free cash flow equals operating cash flow minus gross cash purchases of PP&E. It excludes intangible purchases and strategic share purchases and does not add asset-sale proceeds or subsidies. Ratios and changes are calculated from unrounded reported amounts, then rounded for display. No current market price, market capitalization or consensus estimate is used.
This article is educational analysis based on the company’s published results as of October 30, 2026. It is not investment advice or a recommendation to buy or sell any security.