
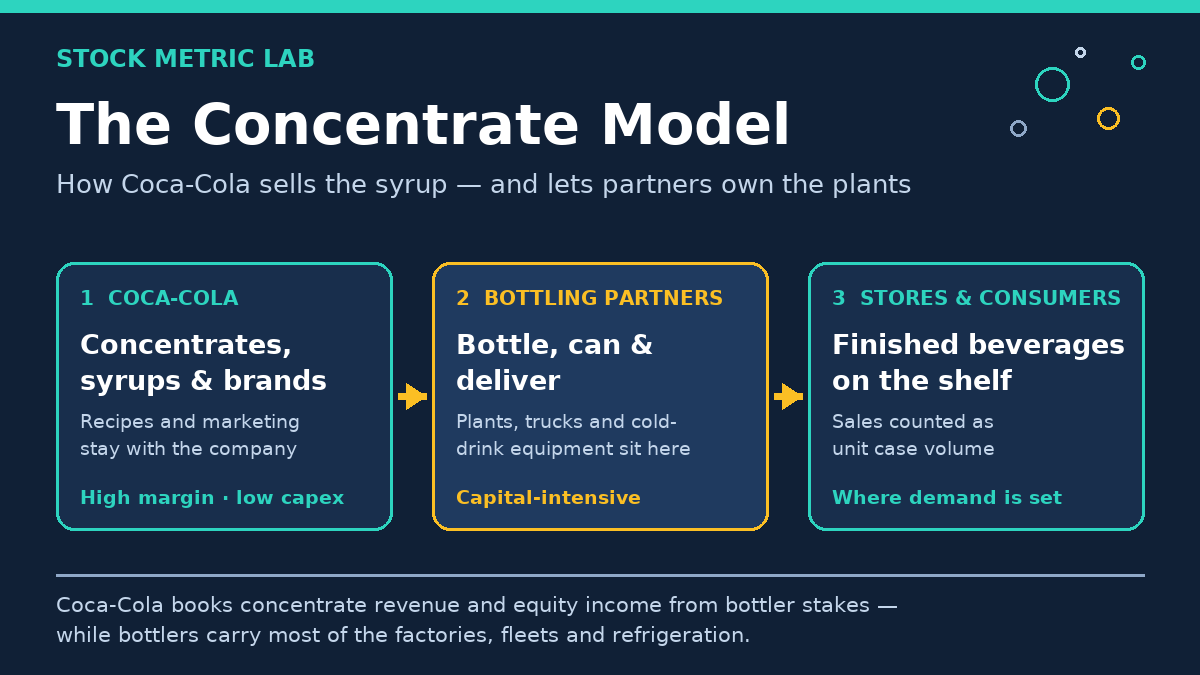
Simplified view of the concentrate-led core. Coca-Cola also has finished-product operations and consolidated bottlers; equity income is not revenue.
The Coca-Cola Company (NYSE: KO) combines a concentrate-led core with finished-product operations. The finished beverage in the bottle is mostly made, packaged, and delivered by independent bottling partners. Concentrates, syrups and brand ownership are central to its economics, although Coca-Cola also sells finished products. This structure helps explain the 63% gross margin, the tiny capital expenditure bill, the free cash flow that converts nearly all of its profit into cash, and a dividend that has risen for 64 consecutive years. This analysis walks through the model using the company’s own filings, with the latest results from the third quarter of 2026.
Coca-Cola investment thesis in one minute
- An asset-light core: Coca-Cola sells concentrates and syrups to bottlers; the bottlers own most of the plants, trucks, and cold-drink equipment. Capital expenditures were just 2.7% of revenues in the first nine months of 2026 (our calculation).
- Cash conversion is the story: free cash flow — Coca-Cola’s own non-GAAP measure, operating cash flow minus equipment purchases — was $11.4 billion in the first nine months of 2026, about 92% of net income attributable to shareowners (our calculation).
- The dividend record needs cash coverage: the quarterly dividend was raised to $0.53 per share in February 2026, the 64th consecutive annual increase (company announcement). Dividends paid in the first nine months of 2026 were $6.8 billion, about 60% of company-defined free cash flow (our calculation).
- Reported revenue understates the system: Coca-Cola records concentrate and finished-product revenue, while equity income from investees ($653 million in Q3 2026) is a separate nonoperating line, not revenue. Consolidated revenue is not the retail value of all beverages sold by the system. Equity method investments — stakes in bottlers — were $20.7 billion on the balance sheet, 19% of total assets (our calculation).
- Main risks: the long-running IRS transfer-pricing litigation, currency swings across a heavily international revenue base, the refranchising program that is deliberately shrinking reported revenue, and “one-off” items that recur often enough to deserve scrutiny.
What Coca-Cola actually does: the concentrate model
A finished soft drink is mostly water. Coca-Cola’s system splits the work of getting it to you into two very different businesses. Coca-Cola makes and sells concentrates, syrups, and beverage bases to bottling partners, and owns the brands, the recipes, and the global marketing. The bottling partners add water and carbonation, package the finished drinks, and run the warehouses, truck fleets, and vending and cold-drink equipment that put them on shelves.
The two roles have opposite financial shapes. Concentrate production needs little heavy equipment, so Coca-Cola’s own property, plant and equipment was $9.5 billion at October 2, 2026 — small next to $39.2 billion of revenue in nine months. Bottling requires plants, lines, fleets and coolers. Independent bottlers carry those investments on their own balance sheets; company-consolidated bottlers remain within Coca-Cola’s statements. This is why Coca-Cola’s gross margin was 63.2% in Q3 2026 while its Bottling Investments segment — the bottlers Coca-Cola still consolidates — earned an operating margin of 13.5% in the same quarter (our calculation from the segment table). Same drinks, two different businesses.
Coca-Cola reports revenue in two layers that readers should keep apart. By type, the Form 10-Q’s revenue disaggregation shows concentrate operations of about $8.2 billion in Q3 2026 (+9%) and finished product operations of about $5.2 billion (+5%): the concentrate layer is roughly three-fifths of revenue, while the finished-product layer includes consolidated bottling and other finished-beverage businesses. By geography, the operating segments are Europe, Middle East & Africa (EMEA), Latin America, North America, Asia Pacific, and Bottling Investments, with a Corporate line and eliminations — the segment table appears later in this article.
One more piece of the model matters for the cash flow section: Coca-Cola also owns large minority stakes in major bottlers, accounted for as equity method investments — $20.7 billion at October 2, 2026. Instead of consolidating those bottlers, Coca-Cola records its share of their profits in a single line, equity income ($653 million in Q3 2026; $1,641 million in the nine months). The release names Coca-Cola Europacific Partners as one such investee. Treat equity income as real but different: it is profit earned inside other companies, and the cash reaches Coca-Cola only when those bottlers pay dividends.
Finally, the company is deliberately shrinking the part of the system it owns. Under its refranchising program it has been selling bottling operations back to partners — bottling territories in India were refranchised in May 2025, the finished product operations in Nigeria were sold in October 2025, and the sale of the African bottling operations is pending, assumed in guidance to close during the fourth quarter of 2026 subject to regulatory approvals (balance sheet assets held for sale: $6,275 million). Refranchising cuts reported revenue — management guides to an approximately 8% headwind to comparable net revenues in 2027 from acquisitions and divestitures — while pushing the mix further toward the high-margin concentrate layer. A falling revenue line at Coca-Cola is not automatically a shrinking business; check unit case volume first.
Latest financial snapshot
Updated October 30, 2026 using Coca-Cola’s Q3 2026 earnings release (furnished October 27, 2026 as Form 8-K Exhibit 99.1) and the financial statements in it; the Form 10-Q for the quarter ended October 2, 2026 was filed October 28, 2026. Dollar amounts are in billions unless noted; parenthetical changes are year over year. GAAP and comparable (non-GAAP) figures are shown separately, and items impacting comparability are identified where they appear.
| Metric | Q3 2026 (three months ended Oct 2, 2026) | Nine months ended Oct 2, 2026 |
|---|---|---|
| Net operating revenues | $13.380B (+7%) | $39.232B (+9%) |
| Organic revenues (non-GAAP) | +7% | +8% |
| Gross profit / gross margin | $8.450B / 63.2% (vs 61.5%) | $24.717B / 63.0% (vs 62.1%) |
| Operating income | $4.465B (+12%) | $13.496B (+13%) |
| Operating margin | 33.4% (vs 32.0%) | 34.4% (vs 33.0%) |
| Comparable operating margin (non-GAAP) | 32.9% (vs 31.9%) | — |
| Net income attributable to shareowners | $4.009B (+8%) | $12.358B (+14%) |
| Diluted EPS (GAAP) | $0.93 (+8%) | $2.86 (+14%) |
| Comparable EPS (non-GAAP) | $0.91 (+11%) | — |
| Global unit case volume | +5% | +4% |
| Cash flow from operations | — (not presented for the quarter) | $12.471B |
| Free cash flow (company definition, non-GAAP) | — (not presented for the quarter) | $11.4B |
Read the two EPS lines carefully. Q3 reported EPS was $0.93 and comparable EPS (non-GAAP) was $0.91. Do not assume adjusted earnings are always higher. The 10-Q reports $172 million of discrete tax benefits, including $57 million of IRS-deposit interest, and separately $117 million of return-to-provision-related tax benefits. These are different categories, not a single $117 million total. Review the company’s complete reconciliation before assigning individual adjustments to the two-cent EPS gap.
Guidance, in management’s words (full year 2026, raised with the Q3 release): organic revenue growth of at least 5%; comparable EPS growth of at least 11%, including an approximately 3-point currency tailwind and an approximately 1-point headwind from acquisitions and divestitures; free cash flow of at least $13.0 billion, built from cash from operations of at least $15.2 billion and capital expenditures of approximately $2.2 billion; and an underlying effective tax rate (non-GAAP) of 19.7%, which excludes the impact of the IRS litigation if the company were not to prevail. For the fourth quarter, management expects an approximately 4% headwind to comparable net revenues from acquisitions and divestitures, partly offset by an approximately 1% currency tailwind — and notes the quarter has six fewer days than a year earlier. Full year 2027 guidance will come with the fourth quarter results; management has flagged an approximately 8% headwind to 2027 comparable net revenues from refranchising and other portfolio changes.
The revenue engines: five segments, two layers
Coca-Cola’s reported segments are geographic, but the economics underneath are the concentrate/finished-product split described above. Figures were checked against the 10-Q segment table. Segment revenue includes intersegment sales; Corporate and eliminations reconcile to consolidated revenue.
| Segment | Q3 2026 revenues | Q3 change | Q3 2026 operating income | Nine-month revenues | Nine-month operating income |
|---|---|---|---|---|---|
| North America | $5.386B | +3% | $1.766B (+5%) | $15.687B (+7%) | $5.067B (+9%) |
| EMEA | $3.104B | +4% | $1.171B (+7%) | $9.356B (+6%) | $3.739B (+7%) |
| Latin America | $1.958B | +25% | $1.152B (+29%) | $5.475B (+18%) | $3.367B (+22%) |
| Asia Pacific | $1.563B | +4% | $0.563B (+8%) | $4.652B (+3%) | $1.755B (−2%) |
| Bottling Investments | $1.523B | +13% | $0.205B (+261%) | $4.690B (+11%) | $0.487B (+108%) |
| Corporate & eliminations | −$0.154B | — | −$0.392B | −$0.628B | −$0.919B |
| Consolidated | $13.380B | +7% | $4.465B (+12%) | $39.232B (+9%) | $13.496B (+13%) |
Three things to notice. First, North America is the largest segment but one of the slowest-growing (+3% in Q3, with unit case volume flat) — the growth engine in 2026 is the international system. Second, Latin America’s +25% revenue growth is not all volume: unit case volume grew 6%, price/mix added 7 points, and currency added roughly 9 points (release operating review). A strong dollar year would run that arithmetic in reverse. Third, Bottling Investments’ operating income more than tripled (+261%) — but from a small base ($57 million a year earlier, so the percentage increase is sensitive to the starting point), and the segment’s 13.5% Q3 operating margin (our calculation) remains far below the geographic segments, because bottling is the capital-intensive layer. This is the segment refranchising is designed to shrink.
How the 7% growth was built: volume, price/mix, and currency
For a beverage company, the quality of revenue growth matters as much as its size. Coca-Cola discloses the recipe. In Q3 2026, reported net revenues grew 7%, and organic revenues (non-GAAP) also grew 7%. The company’s rounded growth bridge includes the following; components need not sum exactly, and the reported-revenue bridge also includes a roughly 1-point divestiture headwind:
- Concentrate sales +7% in the release’s operating-review bridge — the volume-linked component after the bridge’s portfolio adjustments; the 10-Q separately reports unadjusted worldwide concentrate sales volume growth of 6%. Global unit case volume grew 5% (sparkling soft drinks +5%, Trademark Coca-Cola +5%, Coca-Cola Zero Sugar +16%), led by India, China, Mexico, and Brazil. Concentrate sales ran 2 points ahead of unit case volume because of the timing of concentrate shipments to bottlers — a reminder that Coca-Cola’s reported “volume” is shipments into the system, which can lead or lag what consumers actually buy in any single quarter.
- Price/mix +1% — pricing actions, partly offset by unfavorable mix. After several years in which price carried most of the growth at beverage companies, Q3 2026 growth at Coca-Cola was volume-led. That is generally the healthier recipe, and the one to keep checking: if volume stalls while price/mix does the work, the growth story changes character.
- Currency +1 point on reported revenue (and about +2 points on EPS) — a tailwind this year. Coca-Cola earns most of its revenue outside the United States, so the same exposure cuts both ways; Asia Pacific’s price/mix was −2% in the quarter and its nine-month operating income actually fell 2% despite revenue growth, with currency a headwind there.
The bottling system on the balance sheet: equity income
The strangest line in Coca-Cola’s income statement, for readers used to manufacturers, is equity income: $653 million in Q3 2026 and $1,641 million in the nine months — profit that does not come from anything Coca-Cola sold, but from its share of the earnings of bottlers it part-owns. The corresponding balance sheet line, equity method investments, was $20,710 million at October 2, 2026 — larger than the company’s entire net property, plant and equipment ($9,485 million). The investment carrying value is not a measure of the physical plants owned by those investees and is not directly comparable to their underlying factory assets.
Two disciplines follow. First, equity income is accrual profit: the cash arrives only as dividends from those investees, and the cash flow statement shows equity income net of dividends received as a $1,013 million subtraction in reconciling nine-month net income to operating cash flow — meaning the bottlers retained more profit than they paid out in the period. Second, the investees carry their own risks into Coca-Cola’s results: the 10-Q identifies operating and nonoperating adjustments within equity income; in 2025 the company booked a $331 million gain on selling part of its stake in Coca-Cola Europacific Partners. When you value the bottler stakes, you are valuing bottling economics — the low-margin, capital-intensive layer — at one remove.
Cash flow, read correctly
The concentrate-led model limits direct equipment spending, but working capital, tax payments and transaction-related cash flows still require careful reading. The nine months ended October 2, 2026, selected lines checked against the 10-Q cash flow statement (not a complete reconciliation):
| Nine months 2026 | Amount |
|---|---|
| Consolidated net income | $12.460B |
| Depreciation and amortization | $0.783B |
| Net change in operating assets and liabilities | −$0.498B |
| Net cash provided by operating activities | $12.471B |
| Purchases of property, plant and equipment | −$1.063B |
| Free cash flow (company definition, non-GAAP) | $11.408B |
Four lessons hide in this short statement.
1. Coca-Cola’s free cash flow is a company-defined, non-GAAP figure — use its definition and label it. The company defines free cash flow as net cash provided by operating activities less purchases of property, plant and equipment. On that definition, nine-month free cash flow was $11.4 billion. This measure does not deduct acquisitions or all other investing cash outflows; a low equipment-purchase ratio does not make those uses of cash irrelevant. Our explainer on free cash flow covers the concept and why definitions differ by company.
2. Capex intensity is the model’s signature. Equipment purchases of $1,063 million were 2.7% of nine-month revenues (our calculation). When Coca-Cola guides to full year 2026 capital expenditures of approximately $2.2 billion against expected operating cash flow of at least $15.2 billion, it is telling you the reinvestment needs of the concentrate layer are modest — growth is funded mainly through marketing and through the bottlers’ own investment, not through Coca-Cola’s capex.
3. Conversion is high, but read the year-ago column before celebrating the growth. Nine-month free cash flow of $11,408 million equals about 92% of net income attributable to shareowners (our calculation). The year-over-year comparison, however, is badly distorted: operating cash flow in the nine months of 2025 was only $3,652 million, because that period included the remaining fairlife milestone payment (contingent consideration for the fairlife acquisition), most of which ran through operating activities — the net change in operating assets and liabilities was −$8,040 million a year ago versus −$498 million this year. On the company’s definition, year-ago nine-month free cash flow was $2,422 million (our calculation from the same statements). The missing prior-year payment explains a large part, not all, of the increase: $6,069 million was classified in operating cash flow and $104 million in financing cash flow. The 10-Q also identifies stronger cash operating results, receivables factoring and other timing effects. This is why the checklist below insists on comparing cash flow across several years, not two.
4. The dividend is paid out of this cash flow — check the payment calendar before judging coverage. Dividends paid were $6,842 million in the nine months of 2026 versus $4,391 million a year earlier. That 56% jump is not a payout increase: the per-share rate rose about 4%. The 10-Q says the 2026 third quarterly dividend was paid in Q3, whereas substantially all of the 2025 third quarterly dividend was paid in Q4. Payment dates, not policy, moved the line.
Capital returns: the dividend record and modest buybacks
The dividend is the center of Coca-Cola’s capital return story, and the facts are stated in the company’s own announcements. On February 19, 2026, the board approved the company’s 64th consecutive annual dividend increase, raising the quarterly dividend approximately 4%, from $0.51 to $0.53 per share — $2.12 annualized. A record of that length is a policy commitment as much as a payment: management teams protect streaks, which makes the dividend unusually predictable, but also means it should be tested against cash flow rather than assumed safe. The test for the nine months of 2026: dividends paid of $6,842 million were about 60% of company-defined free cash flow of $11,408 million (our calculation), leaving room for debt service, the pending portfolio changes, and reinvestment. Note that “dividends paid” is a cash flow line; it will not match the declared rate times the share count in every period, for the calendar reason explained above.
Buybacks, by contrast, were modest: purchases of stock for treasury were $900 million in the nine months of 2026 ($644 million a year earlier), partly offset by $355 million of stock issuances. The diluted share count was essentially flat — 4,314 million in Q3 2026 versus 4,313 million a year earlier. At Coca-Cola, recent buybacks have not materially reduced the diluted weighted-average share count; the dividend does the heavy lifting. Readers comparing the two U.S. beverage giants, or comparing Coca-Cola with the buyback-driven return stories elsewhere in our coverage, should not import the assumption that repurchases shrink this share count.
Balance sheet, briefly. At October 2, 2026, Coca-Cola held $13,454 million of cash and equivalents plus $231 million of short-term investments and $2,910 million of marketable securities, against total debt of $41,619 million (our calculation: loans and notes payable of $73 million, current maturities of long-term debt of $4,923 million, and long-term debt of $36,623 million). Equity attributable to shareowners was $37,372 million. The balance sheet also carries the refranchising program in plain sight: $6,275 million of assets held for sale (mainly the African bottling operations) against $3,003 million of related liabilities.
Risks investors should not ignore
The IRS litigation. Coca-Cola is in long-running transfer-pricing litigation with the U.S. Internal Revenue Service. The company paid a tax litigation deposit in 2024, and the Q3 2026 release shows the dispute still moving reported numbers: net tax benefits in the quarter included $57 million related to interest earned on that deposit. Management’s guided underlying tax rate of 19.7% for 2026 explicitly excludes the impact if the company were not to prevail. An adverse outcome would raise the tax rate and could require substantial additional payments; the release does not quantify a worst case, and neither do we — read the tax contingency note in the Form 10-Q and Form 10-K before treating the current tax rate as permanent.
Currency and emerging-market exposure. The same international footprint that produced Latin America’s growth also means results are translated from dozens of currencies. Currency was a tailwind in 2026 (about +1 point on Q3 revenue, +2 points on EPS); it has been a headwind in other years and will be again. Volume growth is led by emerging markets — India, China, Mexico, Brazil in Q3 2026 — which ties the growth engine to markets with more volatile currencies, pricing, and politics than the home market.
Refranchising execution and mix. The refranchising strategy raises the quality of the revenue mix, but it makes reported revenue a shrinking, shifting target: management guides to an approximately 8% headwind to 2027 comparable net revenues from acquisitions and divestitures. The pending African bottling sale still requires regulatory approvals, and the held-for-sale accounting has already produced impairment adjustments (a $5 million reduction of a previously recorded impairment charge in Q3 2026; much larger charges in prior periods, including a $393 million charge in 2025 related to operations held for sale in Nigeria). Expect more one-off gains and charges while the program runs, and judge the company on unit case volume and concentrate-layer economics rather than on reported revenue growth.
“One-off” items recur. The $192 million of pension settlement and special termination costs in Q3 2026, the mark-to-market timing on hedges and securities that the company excludes from comparable results every quarter, and the recurring stream of tax benefits all point the same way: Coca-Cola’s comparable (non-GAAP) figures are useful, but the gap between reported and comparable results is a permanent feature, not an accident. Over any multi-year window, some of the excluded items are real costs of doing business.
Affordability and consumer shifts. Price/mix contributed only 1 point in the Q3 2026 growth bridge, which was primarily volume-led, and management commentary across the industry has emphasized price-conscious consumers. If affordability pressure limits pricing while input costs rise, the margin expansion of 2026 (operating margin 33.4% vs 32.0%) becomes harder to repeat. The growth of Coca-Cola Zero Sugar (+16% in Q3) shows the portfolio adapting to health-driven shifts; whether that offsets pressure on full-sugar categories over a decade is an open question, as are sugar taxes and packaging regulation in the company’s many markets.
A practical valuation framework
We do not print live multiples here — prices move daily, and this analysis is built to outlast the quarter. Instead, here is the framework our readers can apply with current market data, in the order the evidence deserves:
- Separate reported earnings, comparable earnings and tax assumptions. Full-year comparable EPS guidance and the underlying tax-rate guidance are different measures from quarterly GAAP results. Do not apply an additional tax adjustment to already-adjusted EPS without reconstructing its tax basis. Model the IRS dispute separately, with clearly stated assumptions.
- Avoid double-counting the equity-income adjustment. Operating cash flow already adjusts equity income net of dividends. Do not mechanically subtract equity income again from OCF-based FCF. Distinguish cash flow available to equity holders from unlevered cash flow before choosing a discount rate. Our ROIC guide explains why the investment base and its definition matter.
- Ignore revenue-based multiples while refranchising runs. A strategy that deliberately removes low-margin revenue will mechanically inflate price-to-sales and depress reported growth without changing the concentrate economics. Earnings- and cash-flow-based measures, tracked against unit case volume, survive the transition; sales multiples do not.
- Underwrite the dividend, not the streak. The 64-year record tells you management’s priorities. The coverage arithmetic — dividends paid of about 60% of company-defined free cash flow in the first nine months of 2026 — tells you whether the policy is currently funded. Both matter; only the second one is evidence about next year.
The honest debate about Coca-Cola is not whether it is a good business — its economics warrant study, but do not settle valuation. It is how much of the future is already in the price: a volume-led growth rate of mid-single digits, a currency tailwind that will reverse at some point, a tax rate that may normalize upward, and a dividend that grows about 4% a year. Investors who require a margin of safety should demand that the price leave room for at least two of those to disappoint at once.
Quarterly checklist for Coca-Cola shareholders
- Volume first: global unit case volume growth, and the gap between concentrate sales and unit case volume (shipment timing can flatter or depress a single quarter by about 2 points).
- The growth recipe: how much of organic revenue growth came from volume versus price/mix — and whether pricing is still available if volume softens.
- The reported–comparable gap: what sits inside items impacting comparability this quarter (tax matters, pension charges, hedge and securities mark-to-market), and whether the “one-offs” are adding or subtracting.
- Cash coverage, counted properly: operating cash flow and company-defined free cash flow against dividends paid — counting how many quarterly dividend payments actually fell inside the period before judging the trend.
- Segment signals: North America unit case volume (flat in Q3 2026), Latin America’s currency contribution, and Asia Pacific’s margin direction.
- Refranchising progress: closing of the African bottling sale, the held-for-sale balances ($6,275 million of assets at October 2, 2026), and any new impairment or gain lines attached to the program.
- The tax file: IRS litigation developments and the running effective tax rate versus the 19.7% underlying guide — the single largest identified swing factor in the reported numbers.
Bottom line
Coca-Cola is the concentrate model working as designed: sell the syrup and the brand, let partners carry the plants, and convert nearly all of the resulting profit into cash. Q3 2026 showed the model’s strengths — revenue up 7% on volume-led growth, operating margin up to 33.4%, nine-month free cash flow of $11.4 billion on the company’s definition, and full year guidance raised — alongside its permanent complications: a reported EPS flattered by tax items, an unresolved IRS case sitting behind the tax rate, management’s projected roughly 8% acquisitions-and-divestitures headwind to 2027 comparable net revenues, which is not a forecast that total reported revenue will fall 8%, and a dividend whose safety rests on cash flow coverage (about 60% of free cash flow for the first nine months of 2026), not on the 64-year streak itself.
Frequently asked questions
Why is Coca-Cola’s capital expenditure so small for a company its size?
Because the concentrate-led core is relatively asset-light, although Coca-Cola also sells finished products and consolidates some bottlers. The bottling plants, filling lines, truck fleets, and cold-drink equipment belong mostly to bottling partners. Coca-Cola’s purchases of property, plant and equipment were $1,063 million in the first nine months of 2026 — 2.7% of its revenues (our calculation). The capital intensity of the system is real; it simply sits on other balance sheets.
Why does Coca-Cola report two EPS figures, and why was the reported one higher in Q3 2026?
$0.93 is GAAP EPS; $0.91 is comparable EPS (non-GAAP). The company excludes selected comparability items from the latter. Tax benefits and excluded costs can work in opposite directions, so comparable EPS need not be higher. The two-cent difference should be read with the complete reconciliation, not inferred from a single tax item.
How does Coca-Cola define free cash flow?
Free cash flow is a non-GAAP measure at Coca-Cola, defined as net cash provided by operating activities less purchases of property, plant and equipment. It was $11.4 billion for the first nine months of 2026 ($12,471 million less $1,063 million, as reported in the release’s cash flow statement), and management guides to at least $13.0 billion for the full year.
What is refranchising, and why will it reduce reported revenue?
Refranchising means selling company-owned bottling operations to independent bottling partners. Coca-Cola loses the finished-product revenue of those bottlers and keeps the concentrate revenue and, where it retains a stake, equity income. Management expects acquisitions and divestitures — mainly refranchising — to be an approximately 8% headwind to comparable net revenues in 2027. That portfolio effect is not the same as a forecast of total revenue growth; the eventual margin and capital-efficiency outcome depends on execution.
How secure is the dividend?
The facts: the quarterly dividend is $0.53 per share ($2.12 annualized) after the company’s 64th consecutive annual increase in February 2026, and dividends paid in the first nine months of 2026 were $6,842 million, about 60% of company-defined free cash flow (our calculation). That is current coverage, not a guarantee — dividends remain at the board’s discretion, and the IRS litigation is the largest identified claim that could compete for the cash.
What is equity income, and why does it matter?
It is Coca-Cola’s share of the profits of bottlers it part-owns but does not consolidate — $653 million in Q3 2026. The stakes themselves are carried as equity method investments of $20,710 million. Equity income is accrual profit; the cash reaches Coca-Cola only when the investees pay dividends, which is why the cash flow statement adjusts for the undistributed portion.
Does Berkshire Hathaway own Coca-Cola?
Berkshire’s 2025 shareholder letter lists Coca-Cola among its major equity holdings. That is a dated primary-source observation, not a claim about today’s exact position. See our Berkshire Hathaway analysis for the capital-allocation context.
Primary sources
- Coca-Cola Q3 2026 earnings release: reported and non-GAAP headlines, operating review and management outlook.
- Q3 2026 Form 10-Q, filed October 28, 2026: financial statements, Note 3 revenue categories, Note 14 tax items and MD&A cash-flow explanations.
- 2026 dividend increase: dividend rate and annual-increase record.
- Berkshire 2025 shareholder letter: dated portfolio context.
Disclosure: This article is for education and research only and is not individualized investment advice. Financial data can change; verify figures in the company’s latest filings before making an investment decision.