
Oil prices affect company margins through the prices a business pays, the prices it receives, and the time between the two. To understand the effect, trace those connections in the annual report rather than treating a move in crude oil as an automatic profit forecast.
This checklist applies the broader guide to reading a 10-K to one practical question: where would an oil-price change enter this company’s results, and what could offset it?
Historical examples: The Delta Air Lines and ExxonMobil examples below use fiscal 2025 disclosures. Reviewed October 25, 2026, this is a filing-reading exercise, not an assessment of either company’s latest results or investment prospects.
1. Identify what the company buys and sells
Start with Item 1, Business, and write down the relevant commodity, product, and segment. An airline buys jet fuel. An upstream producer sells oil and gas. A refiner buys crude and sells refined products. An integrated energy company combines exposures that can move in different directions.
A crude benchmark is therefore only a starting point. Look for the company’s actual fuel cost per gallon, realized selling price, or input-to-product spread. Match the product, geography, currency, and reporting period before comparing changes.
For refiners, the difference between petroleum-product prices and crude prices matters. The EIA explains that crack spreads approximate part of refining economics, but exclude other refining costs and do not cover every product. A wider spread is not identical to a higher consolidated operating margin.
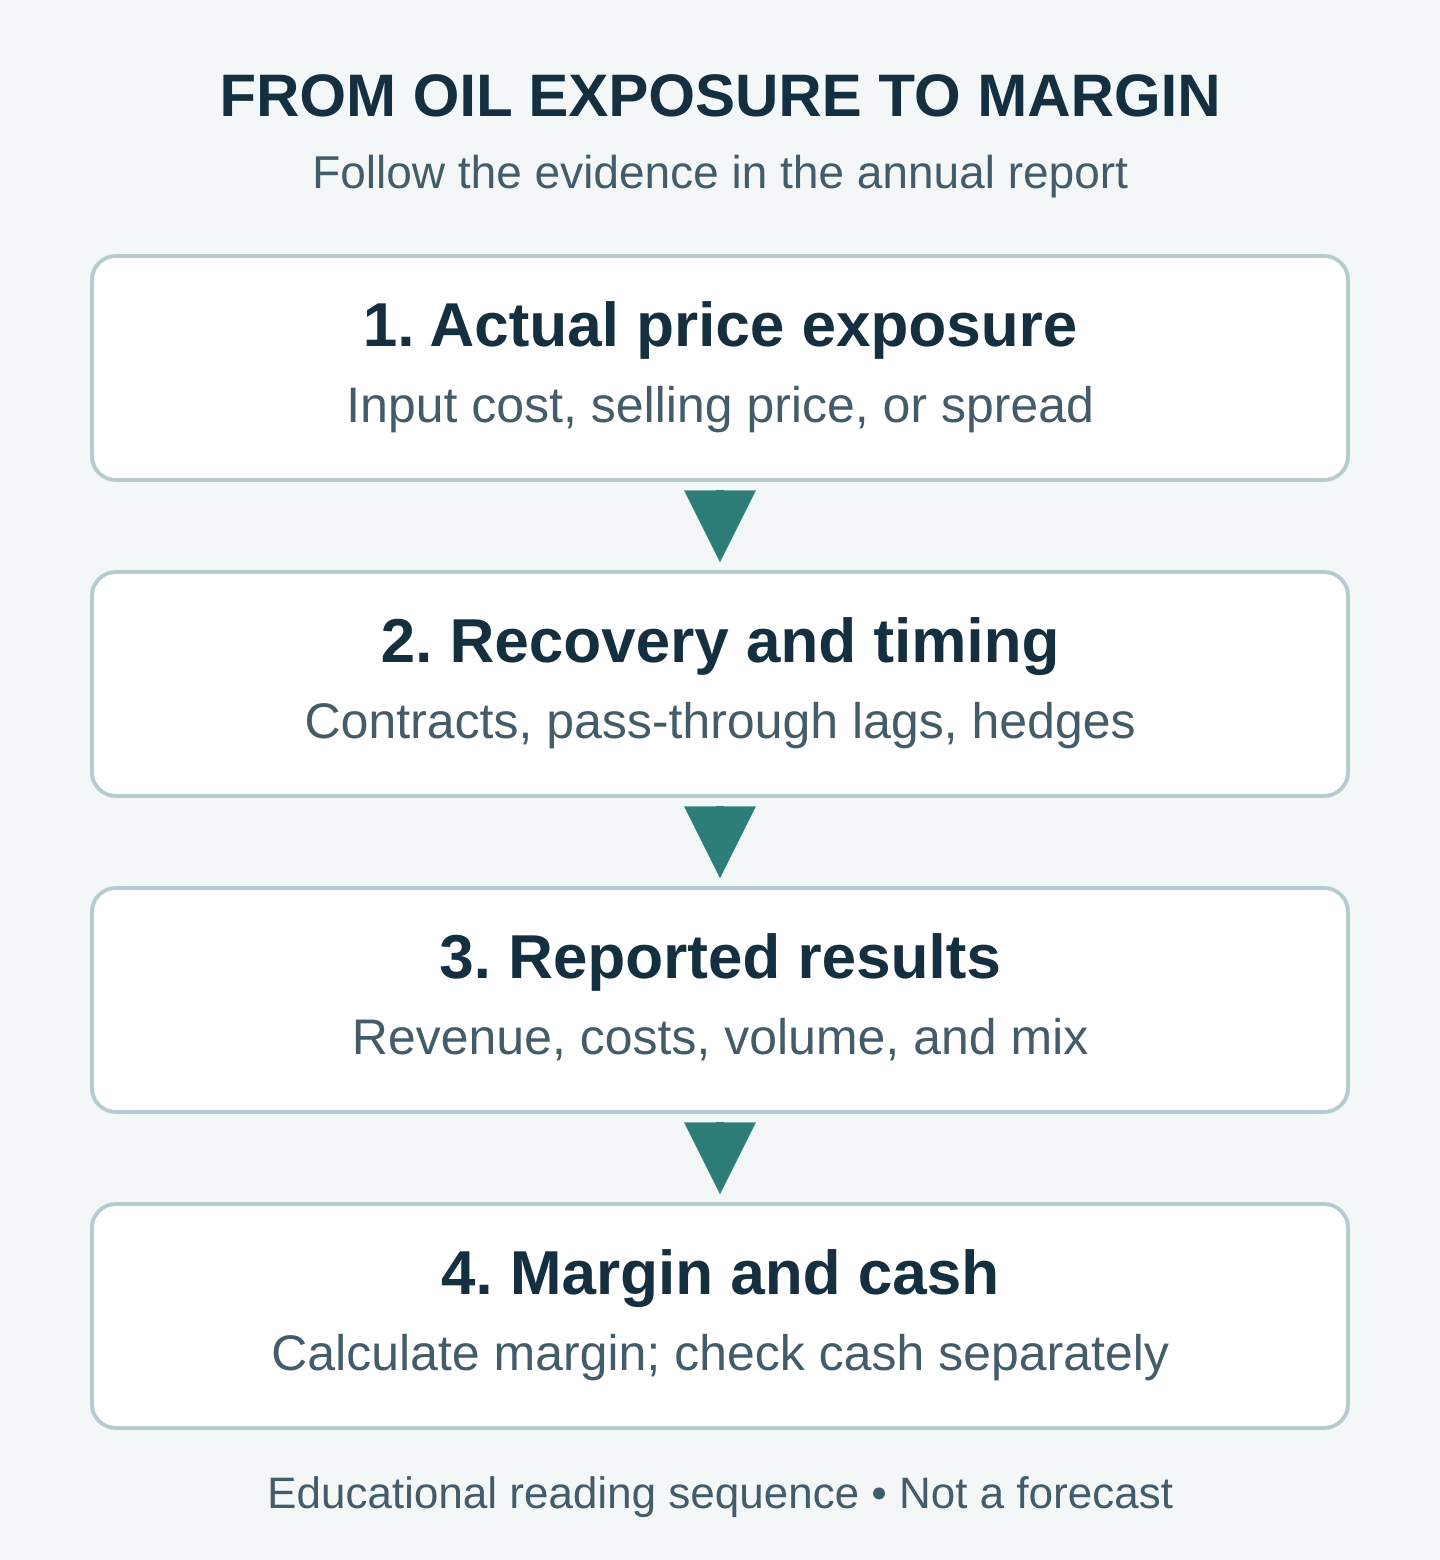
2. Connect four sections of the 10-K
Search the document for “fuel,” “commodity,” “surcharge,” “realized price,” “hedging,” and “sensitivity.” Then read the surrounding paragraphs. Each section answers a different question:
- Item 1A, Risk Factors: What could go wrong? Conditional language describes exposure, not proof that a loss occurred.
- Item 7, MD&A: What changed in the reported period? Look for management’s explanation of selling prices, input costs, volume, and mix.
- Item 7A, Market Risk: What hypothetical price change is being tested? Record the units, time horizon, scope, and assumptions.
- Item 8, financial statements and notes: Where are costs, inventories, derivatives, and segment results recorded? Check the accounting behind the explanation.
The SEC’s guide to Form 10-K explains these sections. Read them together: a risk paragraph, a sensitivity estimate, and a realized expense are three different kinds of evidence.
3. Check the units before using a sensitivity
Delta’s 2025 Form 10-K, printed page 40, says fuel represented approximately 17% of total operating expense that year. That establishes materiality; it does not mean a 10% oil-price rise would reduce the operating margin by 1.7 percentage points.
In Item 7A, printed page 51, Delta estimates that a one-cent-per-gallon increase in jet-fuel cost would add approximately $40 million to annual fuel expense, assuming approximately four billion gallons consumed annually.
Unit check: 4,000,000,000 gallons × $0.01 per gallon = $40,000,000.
The estimate holds annual consumption at that assumed level. Delta says it excludes demand changes, broader economic effects, and mitigation actions. It is an annual fuel-expense sensitivity, not a crude-price sensitivity, an actual loss, or a forecast of net income. The rounded assumption also need not equal reported gallons consumed.
When reading another company’s estimate, retain its original basis. A one-dollar-per-barrel change, a one-cent-per-gallon change, and a 10% price change are not interchangeable.
4. Test pass-through and its timing
Ask whether higher costs can be recovered through a surcharge, contract reset, or negotiated selling-price increase. Identify the covered products, reset frequency, caps, and any delay. The ability to change prices does not establish that customers will accept them without buying less.
Also distinguish preserving profit dollars from preserving a margin percentage. Consider a fictional business, with all figures in millions of dollars and no volume changes:
- Before the shock: Revenue of $1,000 minus operating costs of $900 leaves $100 operating profit, a 10.0% margin.
- No recovery: An extra $20 fuel cost raises costs to $920. Profit falls to $80 and margin to 8.0%.
- Full dollar recovery: A $20 surcharge raises revenue to $1,020. Profit returns to $100, but margin is approximately 9.8% because the revenue denominator increased.
This arithmetic isolates one mechanism. Real contracts, customer behavior, and accounting may differ. If recovery happens next quarter, analyze the temporary squeeze separately from the later recovery.
5. Separate price from volume, mix, and hedges
A smaller fuel bill does not by itself prove greater efficiency. The business may have consumed fewer gallons because activity fell. Compare input price per unit, quantity used, and output delivered. For a business with several products or routes, a change in mix can alter revenue and margin even if individual prices stay unchanged.
Read hedge disclosures precisely. Ask what commodity is covered, how much exposure is hedged, when contracts expire, and where gains or losses appear. An inventory hedge, a derivative covering future purchases, and a fixed-price supply contract serve different purposes. Do not assume that the word “hedged” means all future costs are fixed.
Build a short reconciliation: start with the prior period’s operating profit, identify disclosed price and cost effects, then separate volume, mix, and other changes. Where management does not quantify an effect, mark it “not disclosed” instead of inventing a number. Reconcile any adjusted measure to the reported accounting measure before comparing periods.
6. Read integrated companies by segment
ExxonMobil’s full-year 2025 results, released January 30, 2026, show why a single oil-price label is inadequate. Weaker crude realizations weighed on Upstream, while stronger industry refining margins helped Energy Products. Cost savings, volumes, and other factors also affected results.
Those are different economic effects within one company. Neither explains the entire earnings change. Use the segment discussion to identify the mechanism, then reconcile it with consolidated results. Do not add segment margins together or compare a segment’s earnings measure directly with another company’s operating margin without checking definitions.
The lesson is to investigate the exposure. These examples do not establish a stable relationship between oil prices and every company’s profits or share price.
7. Check cash flow separately
Margin measures profit relative to revenue. Operating cash flow also reflects collection and payment timing, inventory investment, and cash taxes. Capital spending is a separate investing cash outflow, commonly deducted when calculating free cash flow. Higher input prices may require more cash to hold the same physical inventory, even before the full expense reaches the income statement.
Inspect the cash-flow statement and inventory notes before concluding that a margin recovery restored cash generation. For the next step, the free cash flow guide explains how to reconcile operating cash flow and capital expenditure without confusing reported cash with sustainable cash generation.
A one-page oil-exposure worksheet
Copy these prompts into your research notes and attach a page reference to each answer:
- Period and basis: Which fiscal year or quarter, currency, units, and accounting measure am I using?
- Exposure: What does the company buy or sell, in which segment, and at which actual price or spread?
- Materiality: How large is the relevant expense or revenue stream? Is its share measured against costs or sales?
- Sensitivity: What price change, volume assumption, horizon, and exclusions does the disclosure specify?
- Recovery and protection: What can be passed through, how quickly, and what is actually hedged?
- Reported outcome: What did MD&A attribute to price, volume, mix, or other drivers? What remains unquantified?
- Cash check: Did inventory, receivables, payables, or capital spending change the cash outcome?
- Open question: What evidence in the next filing would strengthen or weaken my explanation?
Finish with a bounded conclusion: identify the exposed line item, the likely direction under stated assumptions, the available offsets, and the missing evidence. That is a more useful result than turning an oil-price headline into an unsupported earnings estimate.
Educational information only. The examples are not recommendations to buy, sell, or hold any security.