
Technical analysis foundations
Learn five Japanese pattern families, check the definitions, and recognize when the interpretation fails.
Sakata’s Five Methods, or Sakata Gohō (酒田五法), groups familiar price formations into five Japanese pattern families, as outlined in OANDA Japan’s introduction. It offers a vocabulary for describing peaks, reversals, gaps, directional candles, and pauses. It does not supply five automatic instructions to buy or sell.
This guide is for readers who already understand a candle’s open, high, low, and close. The next step is to describe a sequence without deciding its outcome in advance. The failure checks below are learning questions, not standardized trading rules or tested strategies.
The five methods at a glance
- Sanzan (三山), Three Mountains: three peaks.
- Sansen (三川), Three Rivers: a term used for different reversal formations; check the source’s definition.
- Sankū (三空), Three Gaps: successive price windows.
- Sanpei (三兵), Three Soldiers: a directional sequence of candles.
- Sanpō (三法), Three Methods: a pause followed by renewed movement.
Daiwa’s Japanese glossary lists these five families. They do not all consist of three candles. A three-peak formation can span many sessions, while a conventional three-gap sequence needs four candles.
How to read the diagrams: the five light-background figures use invented OHLC values to isolate the definitions. Teal bodies close above their opens; rust bodies close below them; gray candles provide earlier context. All vertical wicks represent high–low ranges. These are original illustrations, not screenshots, historical evidence, or simulated investment returns. The real XOM screenshots appear separately below.
1. Three Mountains: distinguish peaks from a completed top
Sanzan describes three peaks near a similar area. Monex relates it to a triple top; a formation with a higher middle peak is specifically called Sanzon (三尊), comparable to a head-and-shoulders top.
What to observe: mark the peaks, the intervening troughs, and the wider trend. Ask whether the market has actually turned down or has merely returned to the same area. Our support and resistance guide explains why a zone is more useful than a supposedly exact ceiling.
How the interpretation can fail: a later advance through the marked peaks contradicts the ceiling hypothesis. Do not move the old boundary upward afterward and claim the original reading worked. Record the break and reassess.

2. Three Rivers: the name does not have one universal meaning
Japanese sources themselves use this term differently. Monex uses Sansen for the inverse of Three Mountains: three troughs, related to a triple bottom. A lower middle trough is Gyaku Sanzon (逆三尊), or an inverse head-and-shoulders formation.
Daiwa’s glossary, however, describes three-candle reversal combinations under Sansen, including morning-star and evening-star formations. OANDA Japan’s explanation also uses the star-pattern interpretation.
What to observe: write the specific formation, rather than labeling a chart only “Three Rivers.” Three troughs and three candles are different observations.
How the interpretation can fail: a bottom hypothesis is challenged by a subsequent break below its marked lows. A three-candle reversal interpretation is challenged when the prior trend resumes. Neither name identifies an infallible turning point.

3. Three Gaps: count windows, not just higher opens
Sankū describes three consecutive price windows in the same direction. The traditional reading considers whether a rapid move may be exhausting itself. OANDA describes both an upward version, Sankū Fumiage, and a downward version, Sankū Tatakikomi.
A strict price window means the full trading ranges do not overlap. The Japan Exchange Group’s definition of a window is precise:
- Upward window: today’s low is above the previous day’s high.
- Downward window: today’s high is below the previous day’s low.
An open above yesterday’s close is not enough if the ranges overlap later. Check high and low values, not just the spaces between candle bodies.
How the interpretation can fail: a market can continue in the same direction after three windows. Counting gaps does not establish when exhaustion will occur. Do not turn the traditional interpretation into “the third gap must reverse.”

4. Three Soldiers: three matching colors are not sufficient
The Sanpei family includes the bullish Aka Sanpei (赤三兵) and bearish forms. English readers commonly encounter Three White Soldiers and Three Black Crows. The names preserve color conventions; they do not require white, red, or black chart settings.
StockCharts’ dictionary gives a stricter White Soldiers definition: three long bullish bodies, openings within the preceding bodies, and closes near the session highs. Its Black Crows definition reverses the direction, with closes near the lows. Merely finding three green candles does not establish that those conditions hold.
What to observe: record the preceding trend, body sizes, opening positions, and closing positions. For reversal interpretations, distinguish White Soldiers following a decline from Black Crows following an advance. Sequences inside a trading range need separate context.
How the interpretation can fail: apparent directional strength may be followed by an immediate reversal. Keep that outcome in the record instead of quietly relabeling the sequence.

5. Three Methods: a pause still needs a resumption
Rising and Falling Three Methods are continuation patterns. In StockCharts’ five-candle version, a long directional candle is followed by three smaller candles contained within its high–low range. A fifth candle then closes at a new high in the rising version or a new low in the falling version.
What to observe: separate the first move, the contained pause, and the final candle. A developing pause is not yet the complete five-candle formation. Specify whether your definition checks whole ranges or only bodies.
How the interpretation can fail: the expected resumption may never appear, leaving an incomplete candidate. Even a completed pattern can reverse afterward. “It matched the definition” and “the expected move followed” are separate statements.

A real example: XOM in October 2022
Exxon Mobil Corporation (NYSE:XOM) formed this version of Rising Three Methods on October 13, 14, 17, 18, and 19, 2022. The preceding short-term advance is visible in the first screenshot. The prices below are from Nasdaq’s historical OHLC series, cross-checked against a second public series.
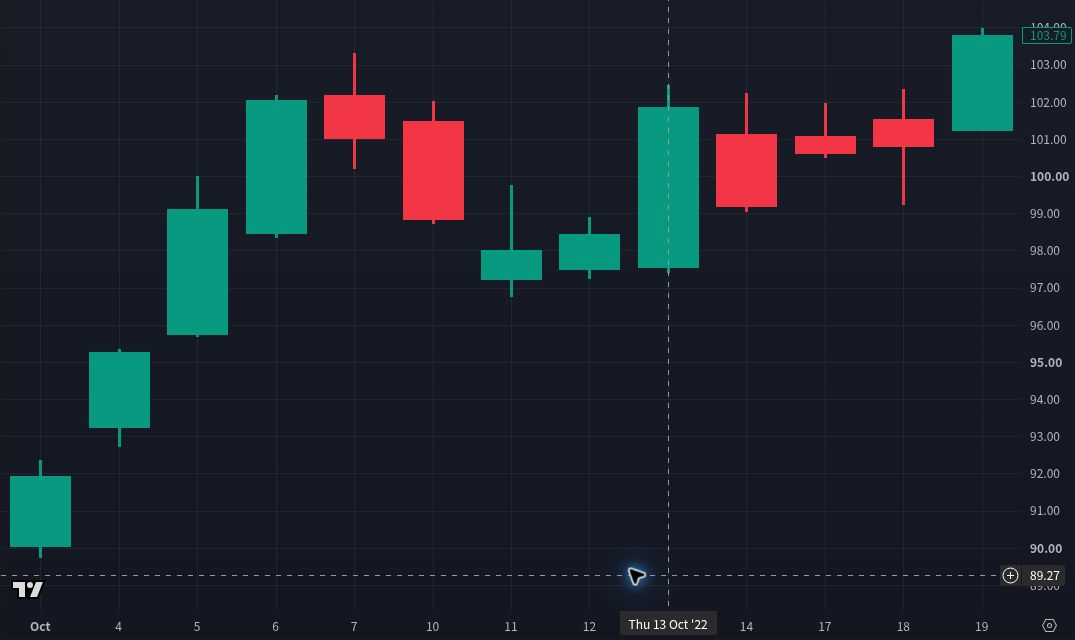
| Session | Open | High | Low | Close |
|---|---|---|---|---|
| 2022-10-13 | 97.55 | 102.45 | 97.40 | 101.87 |
| 2022-10-14 | 101.12 | 102.24 | 99.04 | 99.19 |
| 2022-10-17 | 101.07 | 101.97 | 100.50 | 100.62 |
| 2022-10-18 | 101.54 | 102.35 | 99.23 | 100.80 |
| 2022-10-19 | 101.25 | 103.99 | 101.23 | 103.79 |
Why this fits the stated version: October 13 has a $4.32 body. The next three bodies are $1.93, $0.45, and $0.74, with every high and low inside October 13’s $97.40–$102.45 range. October 19 closes at $103.79, above the first candle’s $102.45 high.
Make the judgment reproducible: StockCharts does not give numerical cutoffs for “long” and “small.” For this research pass, we required the first body to be at least 1.5 times the preceding 20-session mean absolute body, and each middle body to be no more than half the first. XOM passes: $4.32 versus a $1.6635 mean, with middle bodies 44.7%, 10.4%, and 17.1% of the first. These are our screening choices, not official or validated thresholds. The middle closes do not decline every day; the adopted dictionary does not require that.
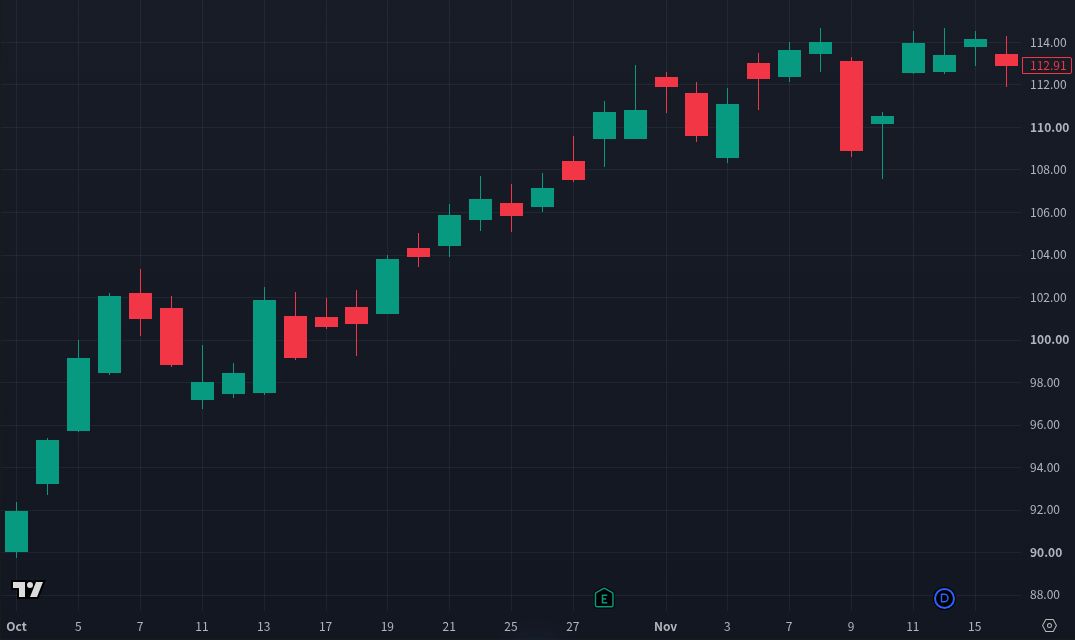
Five, ten, and twenty trading sessions after the October 19 close, XOM closes at $107.14, $109.61, and $112.91. Those are price observations, not realized strategy returns. The path includes a drop from $114.00 on November 8 to $108.90 on November 9. Company earnings on October 28 also fall inside this window; the chart pattern cannot be isolated as the cause of the later move.
Hindsight disclosure: this case was selected retrospectively after its history was known. The first crop hides later bars to teach the observation cutoff, but it does not make the selection prospective. This one example cannot establish a success rate or trading edge. The fictional failures above explain possible invalidation, not its empirical frequency. No claim is made that all five Sakata families have been demonstrated on real historical charts here.
A practical chart-reading exercise
Use one familiar listed company and a completed historical period, such as part of 2024 or 2025. Choosing a company for practice is not a recommendation. Follow the TradingView setup guide if you need help with the controls.
- Fix the chart context. Record the listing, data source, currency, session, price adjustments, and candle interval. Use ordinary candles so the exercise matches the OHLC definitions.
- Choose one family. Write its source and conditions first. For gaps, check full high–low ranges; for Three Methods, decide what must be contained.
- Set an observation cutoff. Examine only the history up to a chosen completed candle. Record whether the formation is complete, incomplete, or absent. “No clear example” is a useful result.
- Write what would contradict your interpretation. Identify the relevant price area or missing condition before inspecting later candles.
- Reveal the later history. Record the outcome without changing the original definition. Include failures and unclear cases, not only attractive examples.
This exercise teaches consistent observation. It does not measure a strategy’s profitability. A performance study would also need explicit entry and exit rules, a holding period, a representative sample, costs, and a separate test period. A few persuasive screenshots cannot supply that evidence.
A short note on Honma and the historical claims
Sakata’s methods are commonly associated with the rice trader Honma (本間宗久). That association should not be presented as proof that he invented modern candlesticks or personally codified all five families.
Shonai Securities’ historical account explicitly questions the evidence for the usual attribution and notes that the cited Sōkyū-ō Hiroku does not discuss charts. The useful lesson here is the modern pattern vocabulary, not an unverified origin story.
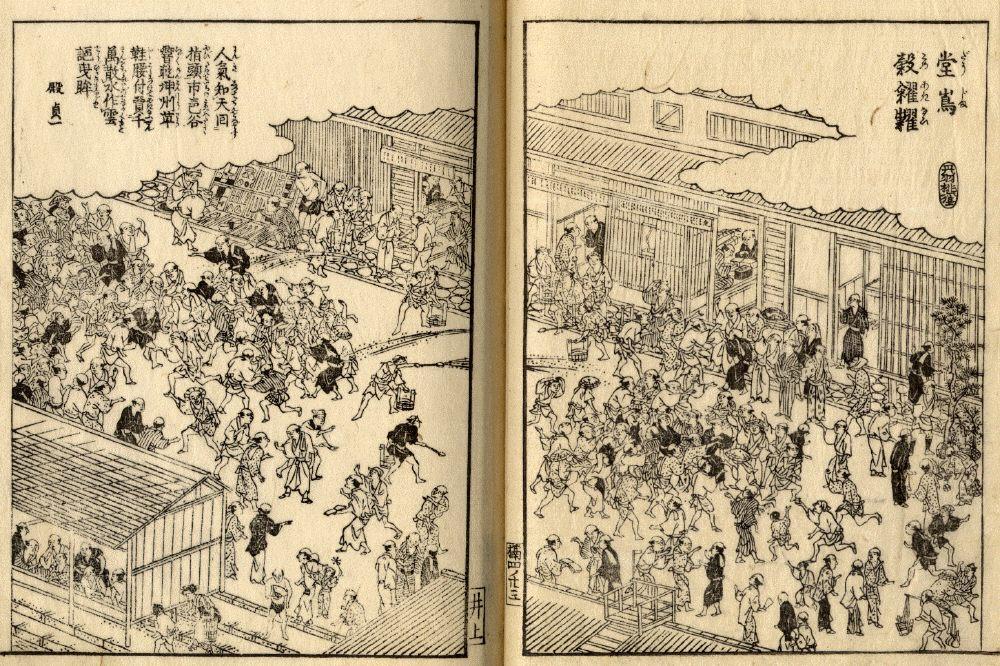
Image reproduced without alteration. Archive reuse terms.
The market scene and the manuscript below offer a glimpse of the wider culture of Japanese rice trading. San’en kinsen hiroku is a work by Ushida Gonzaburō, not Honma; these sources provide historical context rather than proof of the origin of modern candlesticks or the five-family classification.
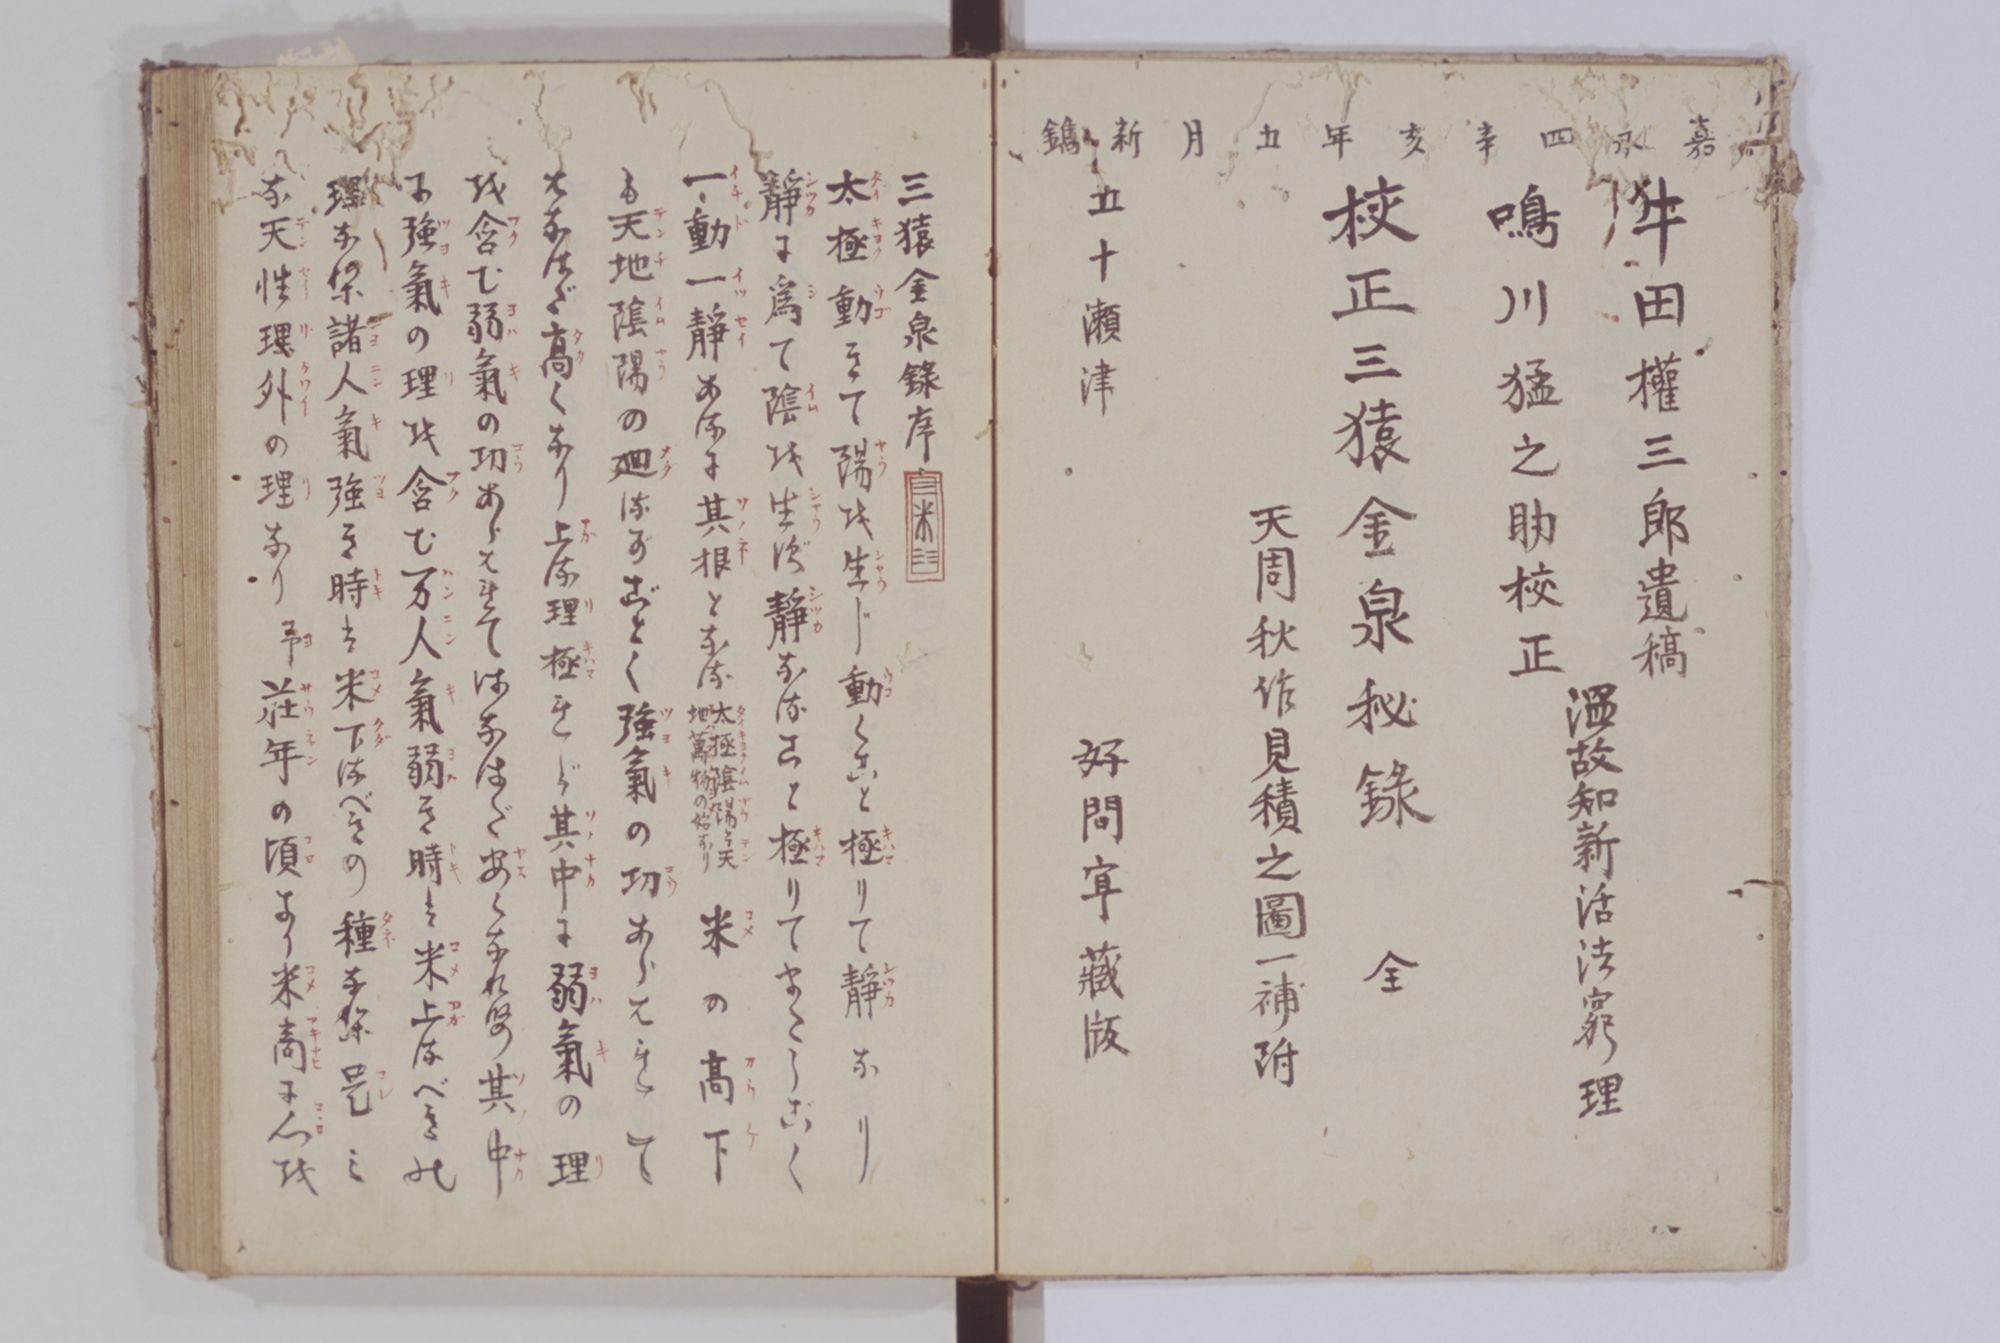
Image reproduced without alteration. Archive reuse conditions.
What these patterns cannot tell you
A named formation does not establish fair value, explain a company’s prospects, or provide a universal success rate. The sources linked here describe definitions and conventional interpretations, not proof of a dependable edge in every market.
Do not treat agreement among several chart tools as independent confirmation automatically. They may summarize overlapping price information. Keep business research and risk assessment separate, using our stock-analysis framework alongside the chart.
For your next review, choose one pattern family, preserve the original observation, and write down what happened afterward. Return to the TradingView guides hub when you need a particular tool.
Educational information only, not personalized investment advice or a recommendation to buy or sell any security. Investing involves risk of loss.