
Technical analysis foundations
Learn to describe price areas, keep your observations consistent, and recognize when a chart interpretation fails.
Support and resistance are price areas where a market has previously struggled to move lower or higher. Marking them can help you organize a chart: where did price turn, what happened on the next visit, and what would change your interpretation?
This lesson uses a fictional stock and a small drawing exercise. You will learn to mark two zones in TradingView, distinguish an observation from a forecast, and record a failed breakout without redrawing the past. You do not need to buy a security or subscribe to a paid plan to learn the method.
If the candles or axes are unfamiliar, begin with how to read a stock chart. For help finding the controls, use the TradingView setup guide.
Affiliate disclosure: This article includes a TradingView affiliate link. Stock Metric Lab may earn a commission if you purchase a subscription through it. The educational exercise does not require a paid subscription.
What support and resistance mean
Support is a price area where a decline has previously paused or reversed. Resistance is an area where an advance has previously paused or reversed. Technical analysts use these observations to form hypotheses about future price behavior. Fidelity’s introduction explains the conventional supply-and-demand interpretation and its limitations.
The useful word is previously. A chart records completed transactions. It does not show a binding promise that buyers or sellers will act at the same price again. New information, changing liquidity, or a broad market move can overwhelm an old area.
Some analysts watch whether a former resistance area later behaves as support, or former support becomes resistance. That possible role reversal needs to be observed. A broken line does not automatically acquire a new role.
A support area also says nothing by itself about a company’s fair value. A stock can repeatedly trade near the same price while its business outlook changes substantially.
Choose a timeframe before describing the trend
First identify the instrument, market, quoted currency, and candle interval. A daily candle summarizes a trading day; a weekly candle covers a longer period. The visible date range is a separate choice.
One common way to describe an upward trend is a sequence of higher swing highs and higher swing lows. A downward trend reverses that relationship. In a sideways range, price repeatedly moves between broadly similar areas. Real charts often contain mixed or ambiguous sequences, so “unclear” is a valid observation.
A swing high or low is a local turning point, and its identification depends on how you define the surrounding observations. You cannot know at the instant of a low that the next prices will rise. If a method needs later candles to confirm a turning point, record when that confirmation became available.
A daily decline can occur inside a longer-term weekly advance. Write down the interval and period instead of treating one description as universally correct. A moving average can provide a separate summary, but you can learn the basic price structure without adding one.
Start with a zone you can explain
Imagine a fictional stock with twelve completed daily candles. It has turned upward after lows of $98.40 and $98.80, and retreated after highs near $109.60 and $109.80. The latest close is $103.00.
For this teaching example, mark a lower reference zone from $98 to $100 and an upper zone from $108 to $110. These deliberately rounded bands surround the earlier turning areas. They are discretionary annotations, not a formula that has been tested for profitability.
A zone acknowledges that the observations are not all at one exact price. Making a band very wide can hide meaningful changes, however. Explain its boundaries before looking at the next candles, and preserve that first version.
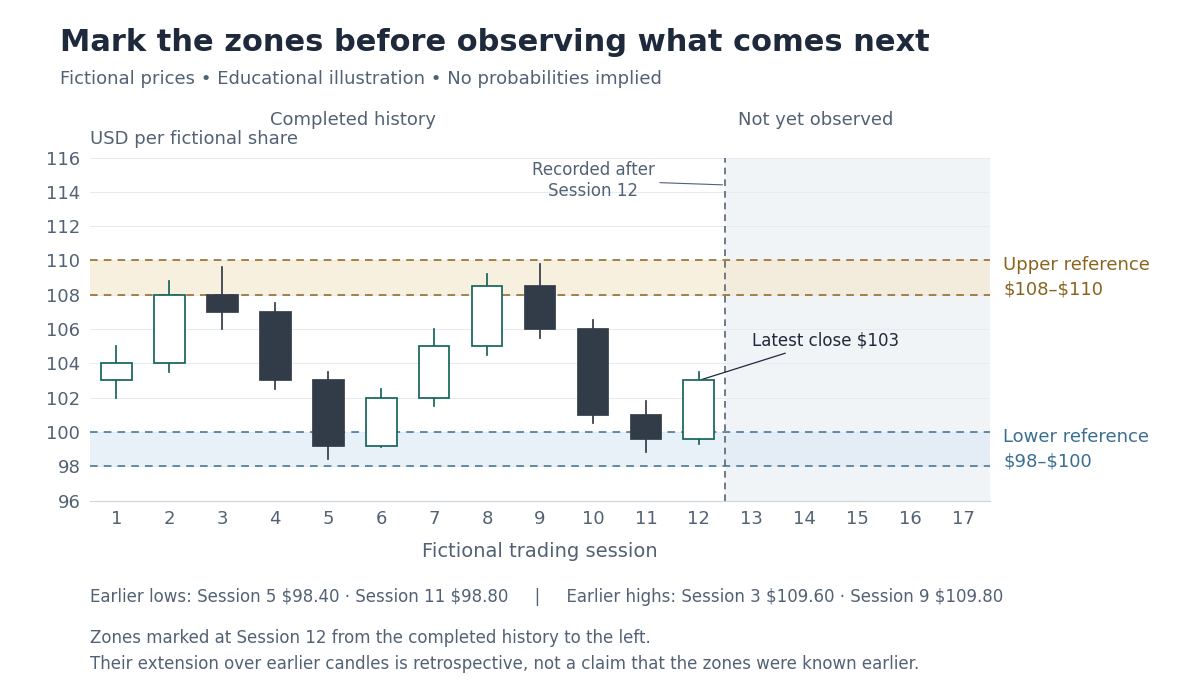
For a real observation exercise, decide whether you are using candle extremes, closes, or another clearly stated convention. Do not use wicks when they make a line look convincing and switch to closes when a wick contradicts it. There is no universally correct width or required number of touches that makes a zone reliable.
Mark the same idea in TradingView
Open one standard candlestick chart. Use a security you can identify, but treat it only as a practice chart. Check the feed, interval, session coverage, and adjustment settings. Different inputs can change historical prices and the areas you mark.
- Choose the observation date. Write down the last completed candle included in your review. Base your annotation only on information available by that point.
- Add a reference line. Select Horizontal Ray from the left drawing toolbar. Place its starting point at the date when you recorded the observation. A horizontal ray extends to the right from that point; its settings let you inspect the price and starting coordinate. See the official Horizontal Ray guide.
- Show the width. Select Rectangle from the drawing toolbar and place its corners around the chosen price band. Use its Coordinates settings to check the bounds. A light background makes the candles readable; Extend right can carry the band forward. See the official Rectangle guide.
- Label and preserve it. Add the observation date, interval, bounds, and brief reason in the drawing’s Text settings or your notes. Lock the drawing against accidental movement. TradingView’s drawing-tools guide explains the chart’s locking controls.
The ray is optional: it can mark the boundary or central reference you want to discuss, while the rectangle shows the wider area. You do not need multiple lines at every nearby price.
These are ordinary drawing tools, not the separate Auto Chart Patterns feature. TradingView’s plan comparison, checked October 22, 2026, includes drawing tools on the free Basic plan. Interface wording and availability can change. A paid subscription is not a prerequisite for this exercise.
Describe a breakout before deciding what it means
A breakout describes price moving beyond a previously identified area. The exact test depends on your stated rule. A candle’s high above a band and its completed close above the band are different observations.
For this example only, use the following convention: record a close above $110 as an upside break, then observe the next three completed daily closes. This is an illustrative record-keeping rule, not a recommended trading strategy.
Now extend the fictional history. Session 13 closes at $106. Session 14 closes at $111, above the previously marked upper zone. From that same point, consider two invented alternatives:
- Path A: the next three closes are $112, $113.50, and $114. The closes remain above the upper zone during this observation window.
- Path B: the next three closes are $108.50, $106, and $104.50. Price closes back inside the zone and then below it. Under the stated convention, this illustrates a failed upside break.
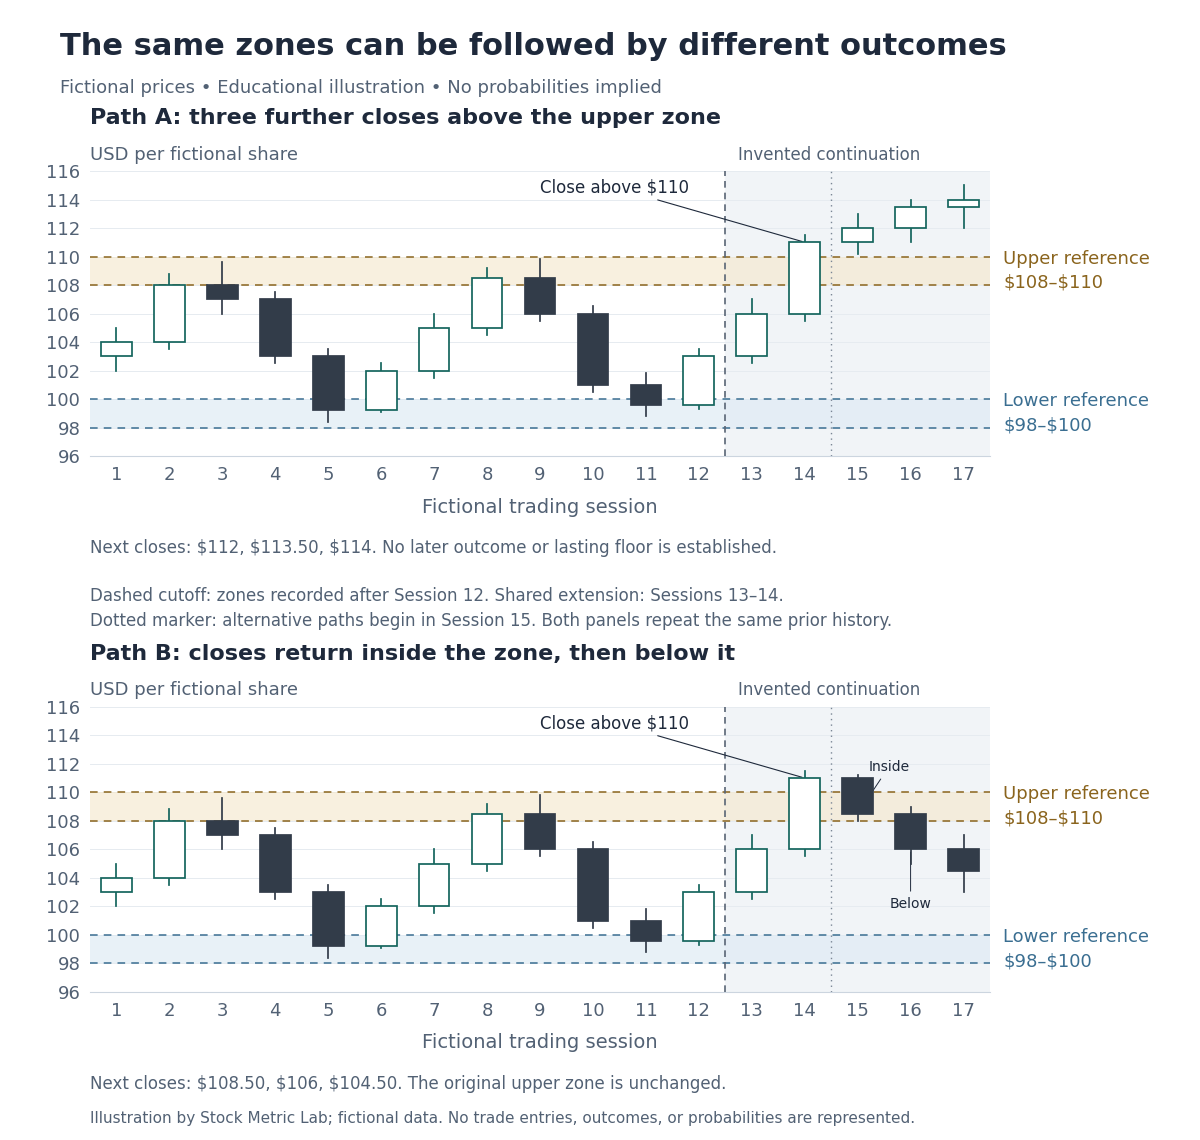
Neither path was knowable from Figure 1. Path A does not establish a lasting support level, and its later outcome is unspecified. Path B does not prove that every breakout will fail. Two invented paths supply no win rate, return estimate, or evidence of a trading edge.
Keep the original zone after a failure. If new information justifies a different annotation, date it as a new version rather than silently changing the earlier record.
Real-chart example: one zone, two different outcomes
The following TradingView screenshots use actual SPY daily prices from 2022. They were captured in October 2026 and annotated for this lesson; they are not screenshots or forecasts published in 2022. The example was selected retrospectively to show both a rebound and a later failure within the same continuous period.
First freeze the exercise at the close of May 13, 2022. The May 12 low of $385.15 was already observable. For this illustration, use a deliberately rounded $380–$390 reference band around that low. The band is an editorial choice, not a statistically validated rule. Keep its boundaries unchanged when viewing later candles.
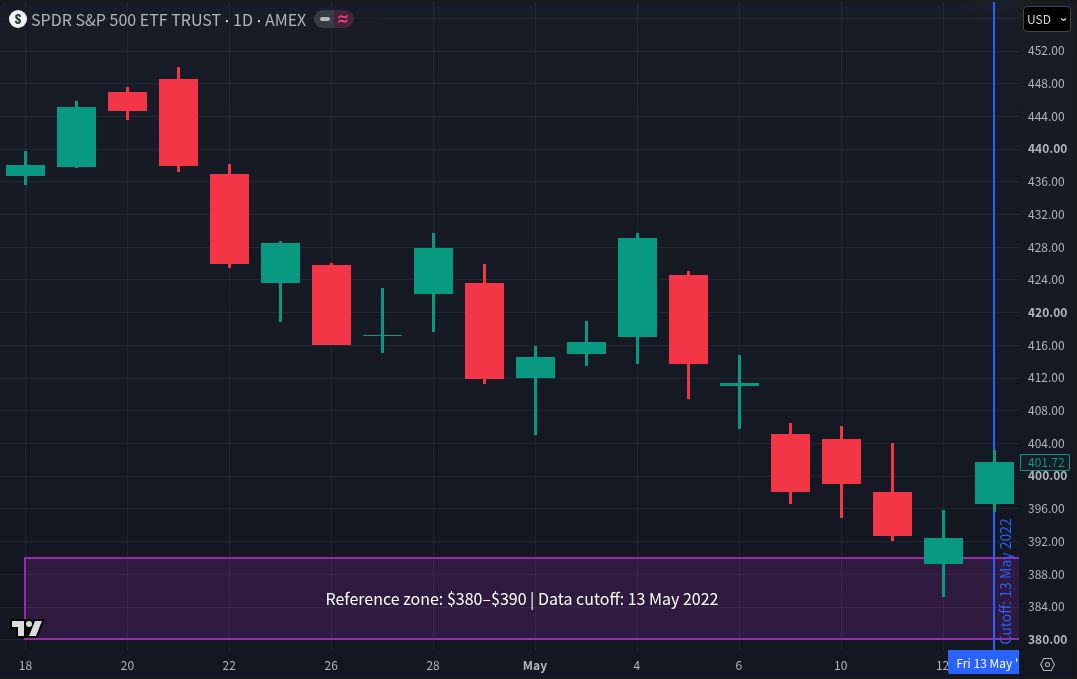
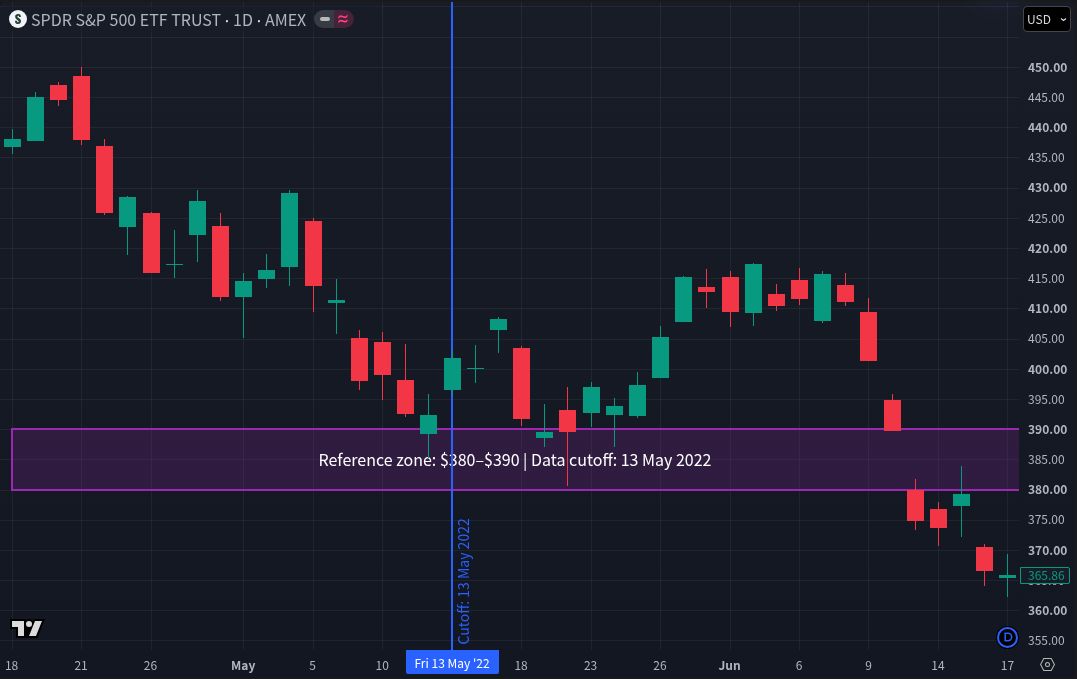
Read the first response as an observed rebound, not a verified profitable trade. These two images cannot estimate a success rate or establish an edge. They contain no specified entry, exit, position size, fees, spread, slippage, or dividend-reinvestment calculation. A fair strategy test would apply a fixed rule to a broader, unseen sample and retain the failures.
Capture settings: SPDR S&P 500 ETF Trust (SPY); TradingView symbol display AMEX, feed labelled AMEX by Cboe One (internal chart identifier BATS:SPY); USD; standard 1D candles; linear price axis; dividend adjustment off; no indicators; chart time-zone display UTC+9. Screenshots captured October 25, 2026. Chart prices and feed labels may differ from another vendor or adjustment setting.
Source: SPY chart on TradingView. Attribution: TradingView policies.
Use volume to ask a better question
Volume describes trading activity during a period. A completed day with two million shares traded may be unusual compared with that instrument’s recent completed days, but the comparison needs a declared reference period and consistent data.
A partly finished day has had less time to accumulate volume. Feeds and session coverage can also differ. Large volume alone does not identify the traders, establish institutional accumulation, or make a breakout dependable. Every completed trade has both a buyer and a seller.
Record the unusual activity, then check dated company announcements or other reliable evidence before attaching a cause. The weekly chart-review guide explains how to connect the observation with business research. The fictional figures in this lesson contain no volume data.
A chart zone cannot cap your loss
A drawn support band does not prevent a gap below it. A planned stop price does not guarantee the eventual execution price, and a limit order can remain unfilled. Read the market and limit order lesson before confusing a chart level with an executable price.
The dollar distance to a zone also does not establish how much money you should put at risk. Position size, liquidity, concentration, costs, and your financial circumstances require separate consideration. ATR% describes recent price ranges; it is not a maximum-loss estimate.
You can complete every exercise here without placing an order.
Practice without rewriting what you knew
Keep a short observation record: instrument and data settings, review date, zone bounds, reason for marking them, what will count as a break, and the date when you will review the outcome. Add the result without deleting ambiguous or failed cases.
TradingView’s Bar Replay can reveal historical candles gradually. For an initial exercise, use only the chart and a written record. The ordinary trading panel and existing server-side alerts can still use real-time data during replay; do not mistake them for the historical simulation.
Hiding future candles does not remove every bias. Choosing a famous winner or repeatedly adjusting your rule after seeing results can still mislead. A chart exercise is not a full backtest: testing a trading strategy additionally requires explicit execution rules, costs, appropriate data, and results beyond the examples used to develop it. TradingView’s strategy documentation discusses these testing limitations.
Check your understanding
- The support band is $98–$100. Does it prevent a trade below $98?
No. It marks an earlier observation. Price can pass through or gap beyond it. - Is a high of $111 with a close of $109 the same as a completed close above $110?
No. The first candle traded above the band but closed inside it. Our example’s close-based convention would distinguish them. - Does Path A prove that $108–$110 has become dependable support?
No. It shows only three further closes above the band. It does not even demonstrate a completed retest of that area. - Can unusually high volume reveal that institutions are buying?
No. Volume alone does not identify participants or their intentions. - You move the zone after seeing the next decline. Can you call the revised version a prediction made at Session 12?
No. Preserve the original record and label the revision with the later information date.
Your next step
Write a two-sentence description of Figure 1: one sentence stating the visible history and one stating what remains unknown. Then explain Path B without moving either zone. Completing that exercise is more useful than filling a chart with additional lines.
When you are ready to try the controls, open TradingView through this affiliate link and follow the drawing exercise above. Start with the tools already available to you. Consider a subscription only if you later identify a specific feature you need and verify it in the current plan comparison.
Educational use only. All prices and paths in Figures 1 and 2 are fictional. They are not investment recommendations, forecasts, or backtest results. Investing involves the risk of loss. Technical observations cannot establish intrinsic value or guarantee future returns.
Platform documentation and plan availability checked October 22, 2026. The instructions are based on the linked official documentation, not a new hands-on Basic-account test.