
Affiliate disclosure: This guide contains TradingView affiliate links. If you subscribe through one, Stock Metric Lab may earn a commission.
A moving average turns a series of prices into a smoother line. It helps you see how recent prices compare with a longer stretch of history. Two versions you will encounter are the simple moving average, or SMA, and the exponential moving average, or EMA.
The key difference is weighting: an SMA gives equal weight to the prices in its window; an EMA gives more weight to recent prices. Neither tells you what a stock is worth or guarantees what happens next.
New to stock charts? First learn how to read candlesticks, time and price axes, and volume, then return to the moving-average line.
What is a simple moving average?
An SMA adds the latest chosen number of values and divides by that number. With Close as its source, it uses closing prices. Each new bar moves the window forward: one value enters and the oldest leaves. TradingView explains this in its SMA documentation.
Consider five hypothetical closing prices: 100, 102, 101, 104 and 103.
5-period SMA = (100 + 102 + 101 + 104 + 103) / 5 = 102.
If the next close is 108, the calculation drops 100:
New SMA = (102 + 101 + 104 + 103 + 108) / 5 = 103.6.
This also explains why an SMA can change when an unusually high or low old price leaves its window, even if the newest price barely moves.
How does an EMA differ?
An EMA combines the newest price with its previous average. Using the conventional smoothing coefficient:
Alpha = 2 / (length + 1)
New EMA = alpha × newest price + (1 − alpha) × previous EMA.
For length 5, alpha is 2/6, or one-third. An EMA needs an initial value. For this teaching example, start with the five-price SMA of 102. When 108 arrives, the EMA becomes (⅓ × 108) + (⅔ × 102) = 104. TradingView’s moving-average overview illustrates this SMA-seeded approach.
Older observations retain diminishing influence through the previous EMA. Length controls the weighting rather than imposing the SMA’s hard cutoff. Starting values and available history matter when reproducing calculations.
An EMA generally responds more quickly to recent changes than an SMA of the same length. That sensitivity can also make temporary fluctuations more prominent. See TradingView’s EMA explanation.
MACD builds on EMAs. Our MACD lines and histogram guide explains how two price averages create the MACD line, and how its signal and zero reference differ.
Length counts bars: 200 days is not 200 weeks
Always read the length together with the calculation timeframe. When the indicator follows the chart timeframe:
- A 200-period SMA on a daily stock chart averages 200 daily bars, generally trading sessions rather than calendar days.
- A 200-period SMA on a weekly chart averages 200 weekly bars.
- A 20-period SMA on an hourly chart averages 20 hourly bars.
Changing the chart from daily to weekly therefore changes the question. Also check the indicator’s own timeframe: TradingView supports separate calculation timeframes, so a daily average can appear on an hourly chart.
Shorter lengths react to smaller changes; longer lengths smooth more history and usually respond more slowly. There is no universally best setting.
How to read the line without overreading it
With a price source, a moving average uses price units. An SMA at 102 is an average price of 102, not a score out of 100. It normally shares the price chart, unlike a bounded oscillator such as RSI.
A rising line shows that its calculated average is rising. Price above it means price exceeds that selected average. It does not establish that the stock is cheap.
Both SMA and EMA lag because they use current and past observations. A crossover, where price or a shorter average crosses another average, describes a change that has already occurred. Sideways markets can produce repeated crossings that quickly reverse. An average can be watched as a possible support or resistance area, but price can pass straight through it.
Use chart observations alongside business, financial and valuation analysis.
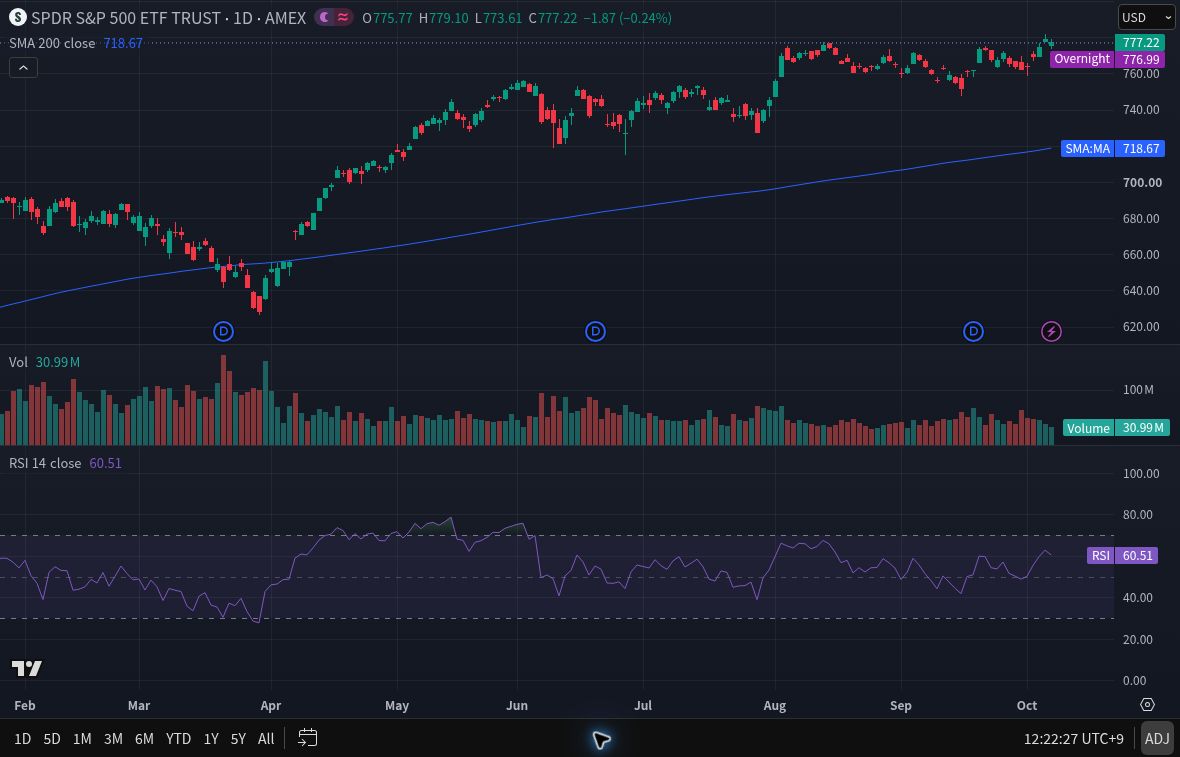
Add an SMA or EMA in TradingView
- Open a symbol in Supercharts and select a standard candle or bar chart and your intended interval.
- Open Indicators in the top toolbar. In Technicals, search for SMA or EMA and choose TradingView’s built-in simple or exponential moving average. Avoid choosing an unfamiliar community script with a similar name.
- Open the indicator’s settings. Set Length, use Close as the source for these examples, and keep Offset at 0.
- Check the calculation timeframe and choose a readable line color. Confirm which line belongs to which indicator.
These steps follow TradingView’s indicator guide. Its SMA and EMA help pages list default length 9, source Close and offset 0. The length is a bar count, not automatically nine days.
Watch the separate Smoothing section. Choosing EMA there adds a smoothed version of the indicator’s output; it does not change the underlying SMA into a price EMA. Set smoothing to None for a single uncomplicated line. TradingView documents the additional smoothing plot.
For a learning exercise, compare an SMA and EMA with the same length, source and timeframe. Look at both a sustained move and a sideways stretch. Then change only the length. This isolates what the setting changes; it does not test whether a trading strategy would be profitable.
For a complete review routine using a moving average and volume, return to the weekly chart review guide.
Check the chart before comparing averages
- Scale: If the line floats separately from price, pin it to the same scale as the symbol.
- Data: Match the symbol, exchange, timeframe, source and trading-session settings when comparing charts.
- Adjustments: TradingView adjusts historical stock prices for splits. Dividend adjustment is a separate setting where available. Different price histories produce different averages.
- Current bar: Its closing price is still developing until the bar closes, so a close-based average and apparent crossing can change.
If you later add a moving-average alert, the TradingView alerts guide explains indicator conditions, bar-close timing, and the separate technical-alert allowance. Check those settings before relying on a notification.
Frequently asked questions
Is EMA always better than SMA?
No. EMA emphasizes newer prices; SMA gives every observation in its window equal weight. Faster response is a trade-off, not proof of better future results.
Why is my 200-period SMA missing?
A 200-period SMA needs 200 usable observations. A newly listed stock or limited history may not supply enough bars, especially on a weekly chart. Check the calculation timeframe and indicator visibility too.
Do I need TradingView Premium for this?
No. As checked on October 10, 2026, Basic allows two indicators per chart. One SMA plus Volume fits that limit. To add a separate RSI, remove one first. Comparing separate SMA and EMA indicators also uses both slots.
I use TradingView Premium, but you can start learning these basics with the free plan. You can open TradingView here (affiliate link); Stock Metric Lab may earn a commission if you subscribe through it.
This article is for education, not personalized investment advice. Indicators cannot guarantee returns, and investing involves risk of loss.