
A 5% price move can feel large until you compare it with the instrument’s recent trading range. Average True Range expressed as a percentage of price, or ATR%, provides that context. For a medium- or long-term investor, its useful role is to describe how much a price has been moving while the investment thesis is reviewed separately.
ATR% does not forecast direction or measure the quality of a business. A calmer chart can still belong to an expensive company, and a volatile chart can belong to a sound one. This guide combines ATR% with a 200-day simple moving average and volume, using Microsoft and SPY as public educational examples.
Before interpreting a trading range, review how to read a candle, its time period, and the price scale.
Begin with the free Basic setup in the weekly chart review guide. The screenshots below show SMA200, Volume, and ATR together. To stay within Basic’s two-indicator allowance, replace Volume with ATR for the range check, then restore Volume for the activity check; calculate ATR% from the displayed ATR and close. Check the current plan comparison only if you need more indicators at once. Premium is my setup, not a minimum requirement for this calculation.
Disclosure: I use TradingView Premium and may earn a commission if you purchase a subscription through links in this article.
What ATR measures
True range takes the largest of three distances: the current bar’s high minus its low, the absolute distance from its high to the previous close, and the absolute distance from its low to the previous close. This captures gaps that a high-low range alone can miss. ATR smooths that series. TradingView’s built-in ATR defaults to length 14 and RMA smoothing; its settings also allow SMA, EMA, or WMA. See TradingView ATR guide.
With Wilder-style smoothing, each new observation updates the previous ATR rather than simply replacing the oldest observation in a 14-bar arithmetic average. Fidelity’s published recurrence is: previous ATR multiplied by 13, plus the latest true range, divided by 14. A large range therefore influences later readings as well as the day it occurs. See Fidelity ATR guide.
The percentage calculation
ATR% = ATR ÷ Close × 100
Use ATR and closing price from the same completed bar.
TradingView documents this normalization for ATR%. It lets us compare recent range relative to price rather than compare dollar ranges across differently priced instruments. The order of operations matters: smoothing dollar true ranges and then dividing by the current close is not necessarily the same as averaging historical daily percentage ranges. See TradingView ATR% calculation.
For intuition only, a 5% move is five times a recent ATR% of 1%, but 1.25 times one of 4%. These are hypothetical numbers, not Microsoft or SPY observations. The comparison provides scale, not a probability: a close-to-close return and a true range are different measurements.
Keep timeframe and settings consistent
An ATR length of 14 on a daily chart uses daily bars; on a weekly chart it uses weekly bars. Weekly true range incorporates a different high, low, and previous close. A weekly reading cannot be substituted for daily ATR or obtained by multiplying it by five. Fidelity confirms that ATR can be calculated across different bar intervals. See Fidelity ATR guide.
For a repeatable review, record the full ticker and exchange, data feed, completed-bar date, timeframe, session, price-adjustment choice, length, and smoothing. Use the same settings for both instruments. A forming bar can change before it closes, and a different feed or adjustment choice can change the input series.
Also check the denominator. ATR% can rise because dollar ATR increases, because price falls, or both. Reading the price chart alongside the percentage avoids describing every rise as an identical change in trading conditions.
Reading the two real charts
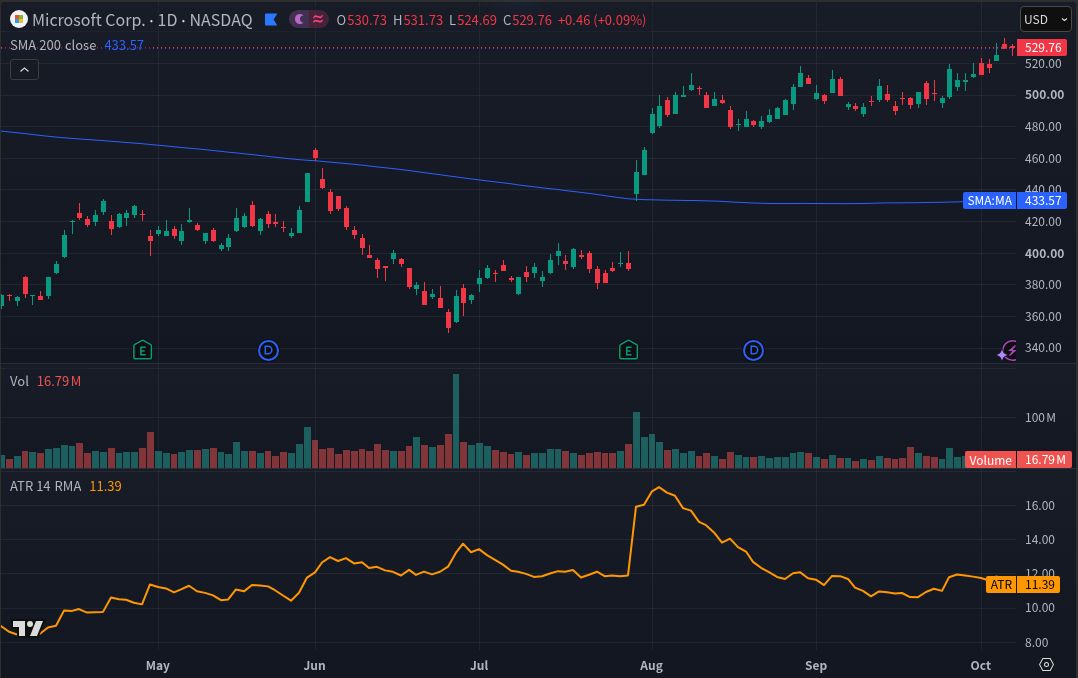
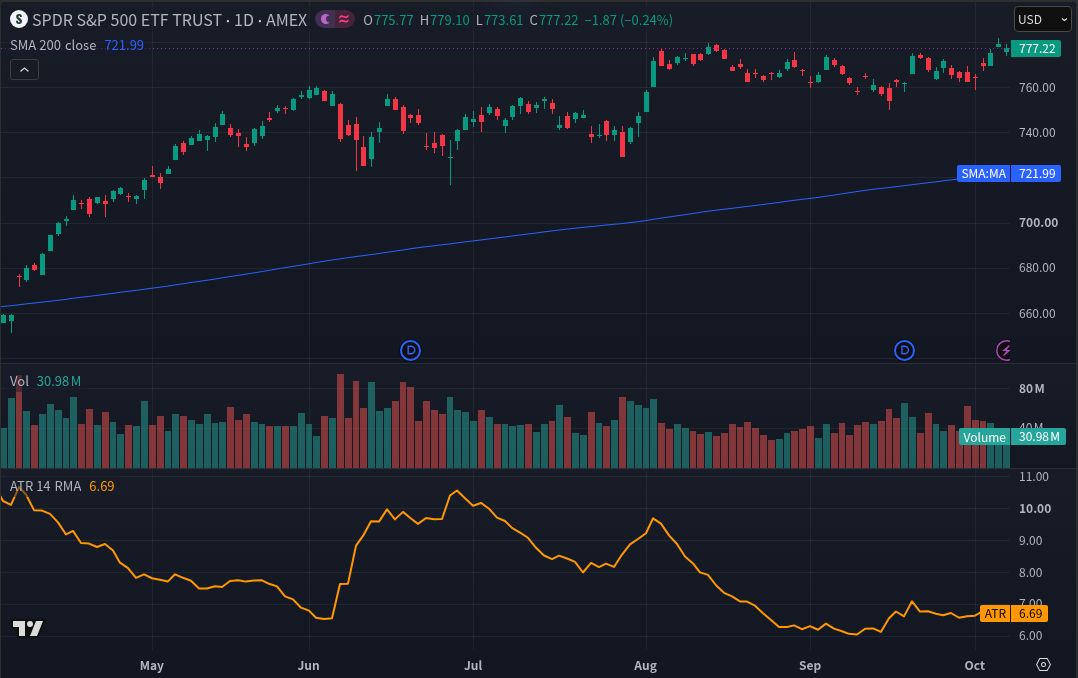
At the completed 7 October 2026 close, Microsoft showed ATR $11.39 and a $529.76 close: 11.39 ÷ 529.76 × 100 ≈ 2.15%. SPY showed ATR $6.69 and a $777.22 close: 6.69 ÷ 777.22 × 100 ≈ 0.86%. These calculations use rounded values displayed on the same date.
Microsoft’s normalized range was about 2.5 times SPY’s in this snapshot. That describes the recent range relative to price; it does not establish a future loss ratio. Both daily charts used the Cboe One feed with dividend adjustment off. Separate session and split controls were not exposed and could not be independently verified.
The chart timezone was New York, UTC−4 at capture, and the daily view spans roughly April through October 7, 2026. The ATR line uses RMA smoothing, length 14, and a native orange line at 2-pixel thickness. The SMA uses 200 daily closes. These images preserve historical readings, not current quotes.
The ATR panels display ranges in US dollars, not percentages. The calculations beneath them convert those readings into ATR%. Keeping that distinction visible makes the example reproducible and prevents a raw ATR line from being mistaken for a normalized indicator.
Normalization removes the immediate price-unit difference. It does not make an individual company and an equity ETF equivalent investments, or measure every risk they contain. A comparison is most useful when the question is narrow: how large was each instrument’s recent true range relative to its price on this date?
Add trend and event context
The 200-day SMA summarizes the last 200 daily closes with equal weights. Its slope and the price’s position relative to it provide a slow-moving view of trend. Because it reacts to past prices, it can lag turning points and produce repeated crossings in a sideways market. See TradingView SMA guide.
Volume adds a different observation: how much trading occurred. Compare a conspicuous volume bar with the instrument’s own recent history, then check the dated company release or market event before assigning a cause. Large volume alone does not identify who traded, prove informed buying, or guarantee that a move will continue. See TradingView volume guide.
A useful review asks three separate questions: Has the range expanded? What does the longer price trend look like? Is there verified news around unusual activity? ATR and SMA both use price data, so agreement between them is not two independent confirmations. Neither volume nor another indicator resolves a weak investment thesis.
Limits that matter over longer holding periods
ATR% is backward-looking. It is not the standard deviation of returns, which measures dispersion around an average. Implied volatility is inferred from option prices and concerns future volatility expectations. Drawdown measures the decline from a previous peak. These answer different questions and should not be substituted for one another. See Fidelity research glossary and Fidelity implied-volatility guide.
A 2% ATR reading does not mean tomorrow’s loss is capped at 2%, that most outcomes must fit within that range, or that a fixed ATR multiple creates a confidence interval. Earnings surprises and other gaps can exceed a recent average by a wide margin. An average contains no maximum-loss guarantee.
Position exposure still depends on the amount invested, the number of shares, and price. ATR% alone cannot determine an appropriate position size or a universal stop distance. Even a stop order can execute away from its trigger price after it becomes a market order. See Investor.gov order-types guide.
The optional SML Position Size Planner (USD 7) compares a proposed purchase with your own cash, loss-budget and concentration limits, including shares already held. It does not choose an ATR multiple or a suitable allocation, and an assumed exit price does not cap actual losses.
For the broader distinction between price movement and the possibility of losing money, read investment risk and diversification explained.
A practical place in the research process
Use ATR% as a compact note in a periodic review: record the completed reading, its recent direction, the SMA context, and any verified event worth investigating. Keep the business analysis alongside it. Stock Metric Lab’s DCF calculator estimates value from cash-flow assumptions; the Reverse DCF calculator asks what constant annual FCFF growth a price implies under selected assumptions. Neither calculation is replaced by a volatility measure. See Stock Metric Lab DCF Calculator and Stock Metric Lab Reverse DCF Calculator.
Educational information only. The examples are not recommendations to buy or sell Microsoft, SPY, or any other security. Past price behavior does not guarantee future results.
I may earn a commission if you purchase a subscription through the following link. Check the exact current features and plan limits for your needs before subscribing.