
Earnings can change a company's investment case overnight, while a 200-day moving average still reflects months of older prices. Anchored VWAP offers an event-specific reference: where the stock has traded, weighted by reported volume, since a chosen starting point. It can make a post-earnings review more precise without establishing whether the business is attractively valued.
If candles and volume are new to you, first read the beginner guide to stock-chart prices and volume before adding an event anchor.
New to this workflow? Start with the free Basic setup in the weekly chart review guide. Use daily price, SMA200, and Volume to record the earnings date and what changed. This article adds the manual Anchored VWAP drawing; check that exact tool in your account before considering a paid plan.
Disclosure: I use TradingView Premium and may earn a commission if you purchase a subscription through links in this article.
What the line actually measures
Anchored volume-weighted average price accumulates price multiplied by volume from the selected anchor, then divides by accumulated volume. With chart bars, the price input is a proxy. A common choice is HLC3, the average of each bar's high, low, and close. TradingView documents that default for its standard VWAP indicator; its anchored drawing settings let users choose the source.
Bar-based AVWAP is therefore an approximation, dependent on the price source, bar interval, and volume feed. It is not necessarily the transaction-by-transaction average used to assess an execution. It cannot identify who traded, which participants still hold shares, or an institution's cost basis.
The starting rule distinguishes three familiar lines. Session VWAP restarts each session. A manual anchored VWAP continues from a selected event. A 200-day simple moving average, calculated from daily closes, rolls over the latest 200 daily bars with equal weight. If calculated on weekly bars instead, a 200-period average covers 200 weeks.
What professional use does and does not establish
VWAP is also used as an execution benchmark. Interactive Brokers' VWAP algorithm documentation describes an attempt to match a volume-weighted execution benchmark and warns that orders can miss that benchmark or remain partly unfilled.
An execution benchmark does not establish that a manually anchored earnings line predicts support or resistance. This workflow is a research method without demonstrated outperformance.
Choose the anchor before judging the result
An earnings release is useful because its timing can be independently checked. Write down a rule before reviewing subsequent price action: use the first regular-session bar after the release becomes public. For an after-hours release, that means the next regular trading session. For a premarket release, it means that day's regular session.
This convention deliberately excludes overnight trading. Record that choice. If your research instead includes extended hours, use a consistent rule, available data, and sufficiently fine bars. For a release during the session, a whole daily bar includes pre-release trading; use an appropriate intraday interval or disclose that limitation.
Keep the anchor fixed even if the line looks unhelpful. Moving it to a later low after seeing a recovery introduces hindsight. Choose the companies and events to review before inspecting outcomes, including uneventful and failed cases. At the next earnings release, start a new event record rather than silently rewriting the old one.
Build a chart you can reproduce
Start with the intended stock listing on a daily chart. Record the exchange, currency, data source, session coverage, adjustment settings, and anchor date. Use daily bars consistently for this longer-horizon review; a different interval may produce a different bar-based average.
In TradingView, choose Anchored VWAP from the left drawing toolbar, then click the selected starting bar. Open its settings and explicitly select the price source you documented. The official drawing guide explains the placement and styling controls.
Use one price chart with AVWAP bands off, a daily SMA set to Length 200, Source Close, and Offset 0, plus Volume below. RSI is unnecessary here. The manual Anchored VWAP drawing, standard VWAP indicator, and Auto Anchored VWAP indicator are different tools. Check the exact tool in your account and the current plan comparison; this article does not establish Premium as the minimum plan for the workflow.
Check why two charts may disagree
TradingView says its default US stock data comes from Cboe and can differ from primary-exchange data, particularly on short intervals or during premarket and after-hours trading. Its data explanation matters for a volume-weighted calculation. Matching tickers alone does not establish matching inputs.
Check the feed, session coverage, price source, interval, adjustments, and exact anchor before comparing values. Where volume is missing, merely a proxy, or limited to one venue, interpretation needs additional caution. An old anchor can become slow to respond as accumulated volume grows. Adjusted historical levels need not be executable prices. New information can overwhelm the reference, and price can gap through it.
A repeatable post earnings review
- Verify the release time and apply the prewritten anchor rule.
- Save the chart inputs and review completed bars consistently.
- Record price relative to AVWAP without turning a crossing into an automatic order.
- Revisit cash-flow assumptions and market-implied expectations.
- Keep failed and ambiguous cases in the record.
Use a declared event sample
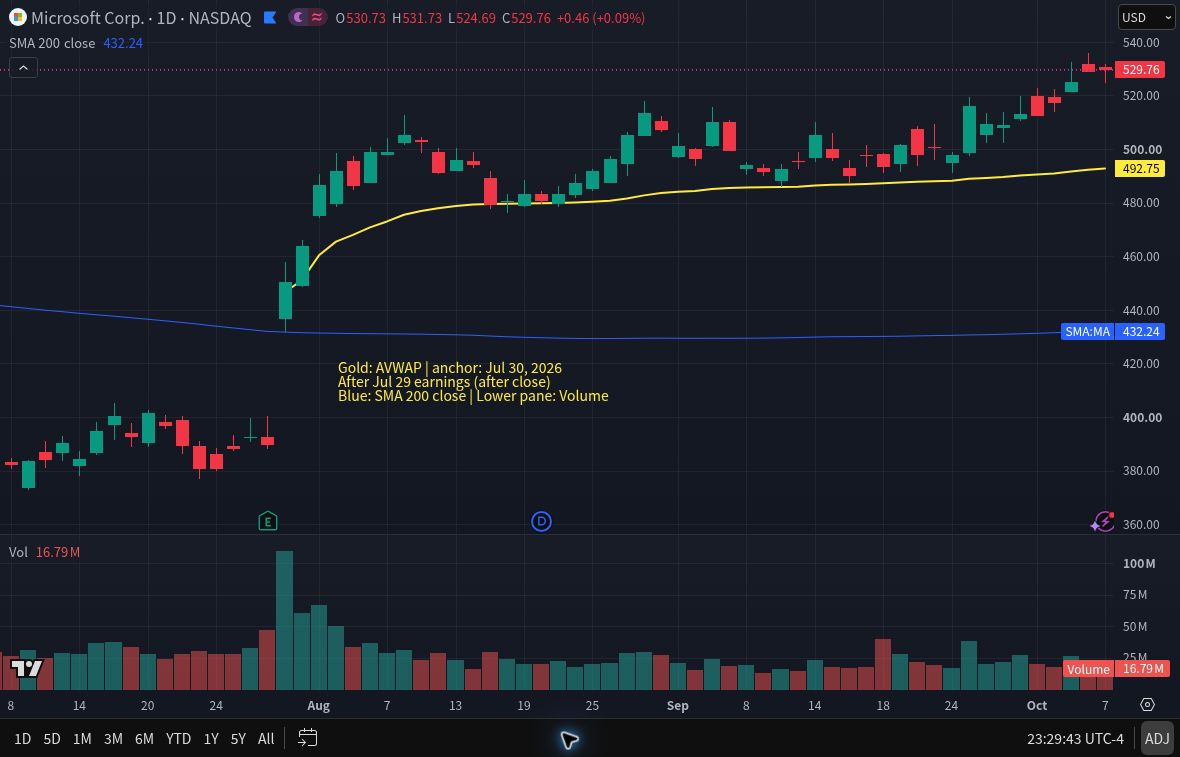
These retrospective illustrations use Microsoft’s two most recent completed earnings releases as of October 8, 2026, selected by recency before inspecting the charts. Microsoft scheduled FY26 Q3 for April 29 after market close and FY26 Q4 for July 29 after market close. The Q3 release and Q4 release confirm those dates. The regular-session anchors are April 30 and July 30.
AVWAP describes the event window, SMA200 supplies broader context, and Volume shows activity. Each endpoint is 69 elapsed calendar days after its anchor; visible pre-event history differs. Two illustrations cannot establish effectiveness.
Both screenshots use Nasdaq-listed MSFT via Cboe One, USD, daily bars, New York time, dividend adjustment on, HLC3 AVWAP with bands off, and SMA200 Close with Offset 0. Daily bars follow the main exchange session. Captured October 8, 2026 UTC.
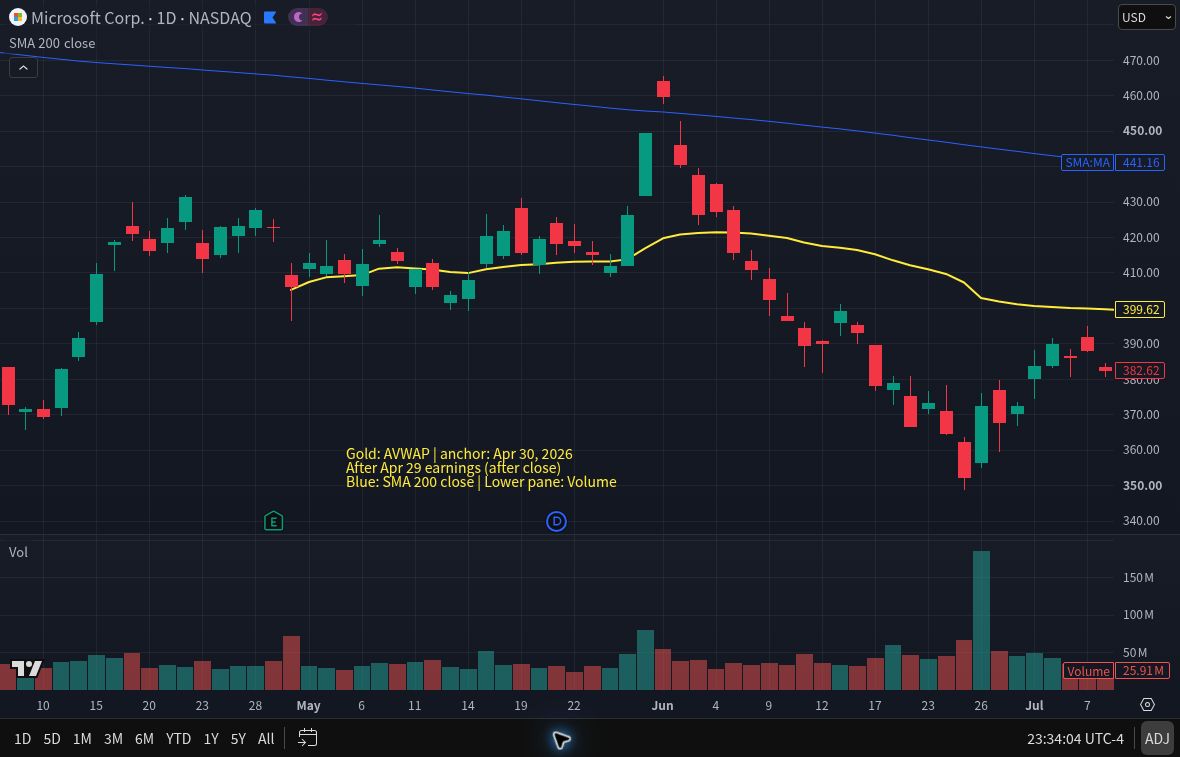
The April example ends below both lines after an earlier rise. The anchored line did not provide a lasting floor.
Turn observations into questions
Compare price with both lines, then ask a business question rather than treating the combination as an order:
- Above both: Have the earnings assumptions improved enough to justify the stronger price?
- Above AVWAP, below SMA200: Is a post-earnings recovery developing within a weaker long-term backdrop?
- Below AVWAP, above SMA200: Does recent weakness challenge the longer-term picture?
- Below both: Has the business deteriorated, or do the valuation assumptions still hold?
These are research prompts, not buy or sell signals. Both lines use price data, so agreement is not independent confirmation. Volume adds activity context without identifying institutional participation. Repeated crossings can make the framework unhelpful.
A separate hypothetical failure sequence makes the risk clear: a stock rises, falls below AVWAP, briefly recovers, then falls again. Treating every upward crossing as confirmation repeatedly changes the conclusion. The earnings thesis might remain intact or deteriorate; business evidence must resolve that question. This is a conceptual example, not a backtest.
Keep valuation as a separate test
Update the business analysis first. Read the release and filing for changes in demand, margins, reinvestment, financing, and dilution. Distinguish recurring changes from temporary effects before revising cash-flow assumptions.
The Stock Metric Lab DCF Calculator estimates value under an assumed FCFF growth path, discount rate, and terminal growth rate. Compare justified scenarios and record why they differ. An attractive-looking AVWAP relationship cannot make unrealistic cash-flow assumptions credible.
The Reverse DCF Calculator asks what constant annual FCFF growth rate would reconcile a share price with the other model inputs. It does not solve directly for revenue growth or operating margins. Judge that implied cash-flow requirement against a separate business model. A lower share price can still embed demanding expectations when the earnings outlook has weakened.
Keep two dated notes: what changed in the business, and what the chart shows since the event. When they disagree, investigate the disagreement instead of adjusting the valuation to fit the line.
For the business-side record, the optional SML Earnings Check workbook (USD 9) keeps quarterly results, source details and reasons for revisiting assumptions together. Keep the chart record separately; the workbook does not import chart data or generate trading signals.
AVWAP provides a consistent event reference. Whether a stock deserves further research still depends on the business, the price, and the risks.
Educational information only. This article is not individualized investment advice or a recommendation to trade. Investing involves risk, including loss of capital.
I may earn a commission if you purchase a subscription through the following link. Check the exact current features and plan limits for your needs before subscribing.