
POC Value Area and Common Mistakes
Fixed Range Volume Profile adds a useful question to a stock review: where was the recorded trading activity concentrated during a particular period? The answer can help organize observations around an earnings announcement or another event. It cannot establish a company's intrinsic value or reveal who still owns shares at each price.
This guide combines a fixed-range profile with a 200-day simple moving average. The profile summarizes activity within one chosen window; the average gives longer-term price context. Use the combination to frame research questions and test the sensitivity of a chart interpretation.
For a first look at the chart, learn how candles and volume bars are read over time before studying volume grouped by price.
Start with price, SMA200, and Volume on free Basic using the weekly chart review guide. That routine lets you review trend and activity by day before adding a profile by price. This example uses the native Fixed Range Volume Profile drawing. Volume Profile drawings, indicators, and chart types are distinct features and can have different availability. Check the exact tool in your account and the current plan comparison before choosing a subscription. My use of Premium does not establish it as the minimum plan for this drawing.
Disclosure: I use TradingView Premium and may earn a commission if you purchase a subscription through links in this article.
What POC and value area mean
The point of control, or POC, is the price row with the highest recorded volume in the selected period. Value area high and low, VAH and VAL, bound the area selected using a target share of volume, commonly 70%. Discrete rows mean the selected area need not contain exactly the target percentage. These definitions describe a historical distribution. A 70% setting supplies no 70% probability that future prices will stay inside it. See TradingView's volume profile concepts.
Treat a wide row as a place to investigate. It does not establish institutional cost basis, ownership, or fundamental fair value. Repeated trading can involve the same shares changing hands, and every completed trade has a buyer and a seller. A crowded historical price area offers no guarantee of a future bounce.
Choose the question before the range
Write down the event and the review date before placing the tool. For an earnings study, distinguish the announcement time from the first full session after the release. An after-hours announcement belongs to a different information set from the session that ended before it.
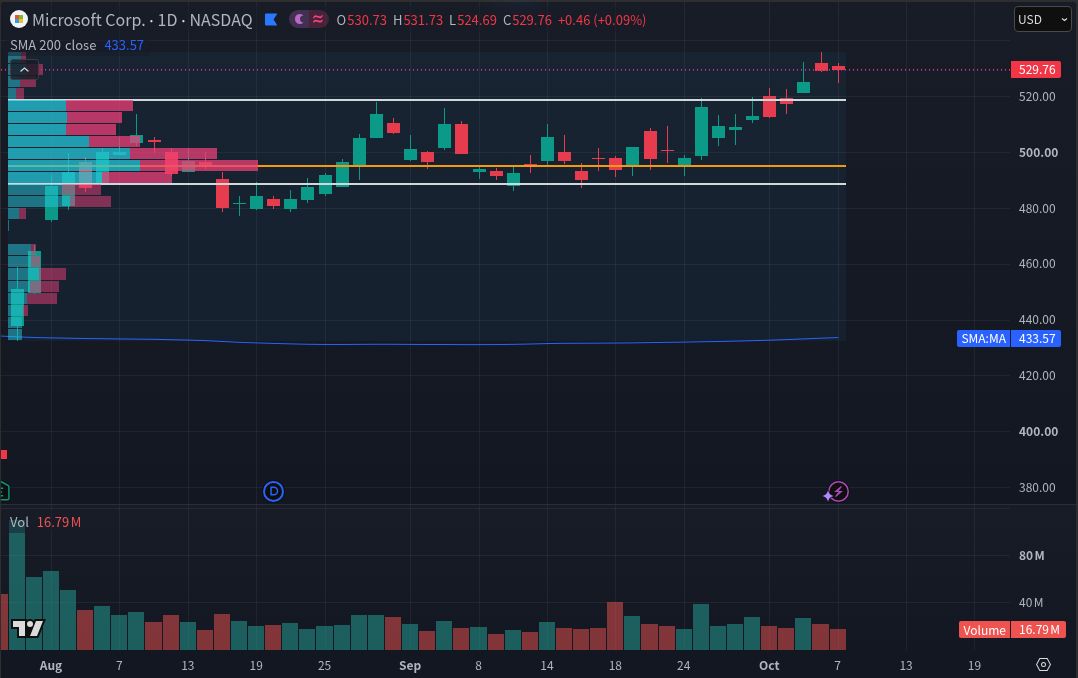
The worked comparison uses MSFT daily bars from July 30 through October 7, 2026, inclusive: 49 trading sessions. Both figures retain that range and change only the row-count input. The window was chosen before comparing settings. It remains a retrospective illustration, with no evidence that this rule worked prospectively.
Do not slide the left boundary until the POC aligns with a recent low. Record the original choice, including an unhelpful outcome. If an alternative range has a sound reason, preserve it as a separate comparison rather than silently replacing the first.
Build a reproducible chart
Use standard daily candles for the intended MSFT listing. Add Simple Moving Average with Length 200, Source Close, Offset 0, calculated on daily bars. This averages 200 daily observations and reacts slowly; a weekly calculation would answer a different question. TradingView's SMA guide explains its inputs and lag.
Select the native Fixed Range Volume Profile drawing and set its endpoints to the recorded sessions. Keep Extend Right off for the completed comparison. Choose Number of Rows, begin with 24, and set Value Area Volume to 70. Then repeat with 48 rows. These are demonstration choices, with no claim that either setting is optimal.
TradingView's FRVP documentation describes lower-timeframe inputs selected under a bar limit. Older history can fall back to chart resolution when intraday data is unavailable. With Number of Rows, prices are grouped using whole ticks, so the actual row count can differ from the requested count. More rows do not create more detailed underlying data.
Read the pair without counting two votes
First describe the long-term context: is the completed daily close above or below SMA200, and is the average rising or falling? Then locate the close relative to the completed profile's POC and value area. Keep these observations separate from the explanation you propose for them.
In Figure 1, the October 7 close is $529.76, above SMA200 at $433.57 and above the upper value-area boundary. This describes the captured chart, without establishing accumulation or attractive valuation. Both displays reuse price information, so agreement is not two independent confirmations of a trading edge.
A narrow-volume area can suggest another question: did the stock pass through quickly, or does the selected data miss part of the activity? Do not infer that price must accelerate there again. Read the release and subsequent filings before attaching an economic story to the shape.
Check sensitivity before trusting a level
Compare both profiles without changing the range, feed, sessions, adjustment settings or value-area percentage. Record whether the POC stays in the same broad region and whether the boundaries materially move. The figures show a settings experiment, not a forecast or a backtest.
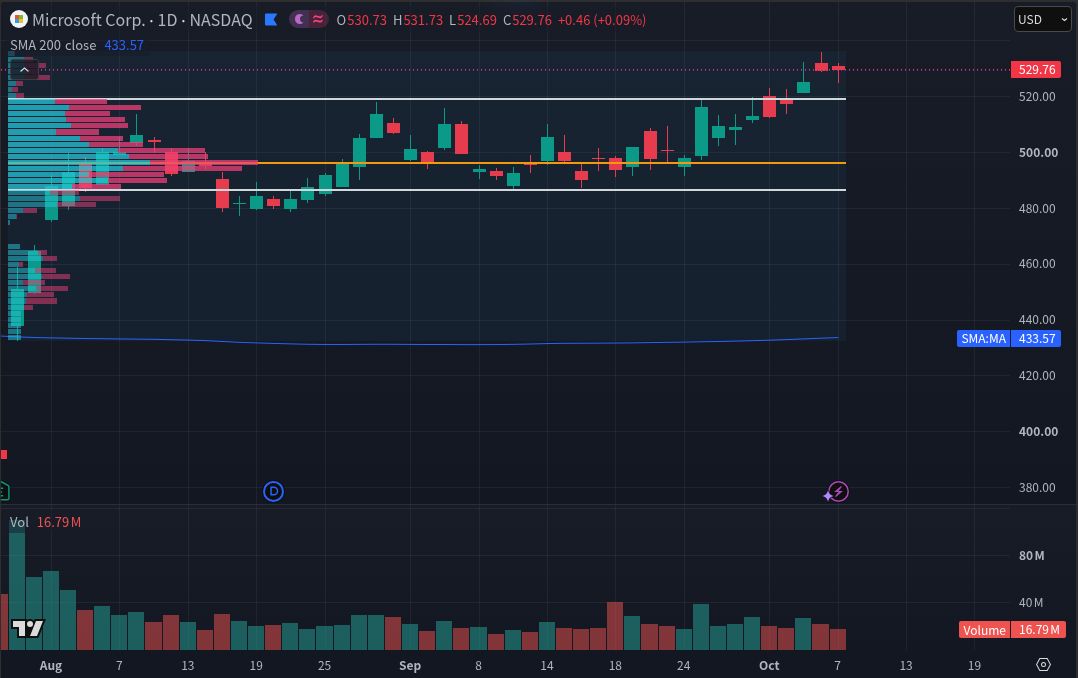
The finer bins preserve the broad concentration, but the POC shifts slightly upward and the lower value-area edge shifts downward. Exact POC and boundary prices are not numerically labeled, so none are estimated here. The lesson is to preserve a zone and the settings behind it.
| Observation | What it can support | What to check next |
|---|---|---|
| Similar broad concentration | A description that survives this row-count change | Whether another justified range changes it |
| POC shifts between rows | The exact line is sensitive to binning | Use a zone and preserve both settings |
| Value-area edges move | The boundary depends on the chosen representation | Avoid treating one edge as an exact trigger |
When two charts disagree, compare the full symbol, feed and delay status before changing your interpretation. TradingView says its default US equity feed uses Cboe data, which can differ from primary-exchange data. Then check date boundaries, session inclusion, adjustments, row layout and available history. These figures use Cboe One data and dividend adjustment off; separate session and split controls were not exposed in the captured setup.
Avoid three interpretation errors
- Reading colors as investor identity. TradingView classifies profile up/down volume using bar direction. The colors do not identify institutional buyers or sellers, and a displayed difference is not an audited measure of their net purchases.
- Using the finished profile in an earlier decision. A profile ending in October includes information unavailable in August. To examine an August decision, end the calculation at that date and use only information then available. A horizontal line drawn back across history does not make its final value knowable earlier.
- Changing several inputs at once. If dates and row count both change, the comparison cannot isolate the effect of either. Record one controlled change at a time, including the result that weakens your original interpretation.
Return to business value
Use the Stock Metric Lab DCF Calculator to examine valuation assumptions separately. Its FCFF model relates cash generation, growth, discounting, cash, debt and diluted shares to an estimated value per share. A volume concentration cannot supply those assumptions or validate the result. Preserve the chart observation and the valuation case as distinct notes.
Educational information only. This is not individualized investment advice or a recommendation to trade MSFT or any security. Chart studies can fail, and investing can result in loss of capital.
I may earn a commission if you purchase a subscription through the following link. Check the exact current features and plan limits for your needs before subscribing.