
Affiliate disclosure: This guide contains TradingView affiliate links. Stock Metric Lab may earn a commission if you purchase through them. You can explore TradingView here.
MACD stands for Moving Average Convergence Divergence. It compares two moving averages to help describe price momentum. The useful beginner question is: how is the relationship between recent prices and their longer-term average changing?
Start by understanding the lines and bars. A crossover can prompt a closer look at a chart, but it cannot tell you whether a business is worth buying or guarantee what its share price will do next.
New to chart reading? Start with our stock-chart basics guide for candles, timeframes and volume.
What do the MACD line, signal line and histogram mean?
The standard 12, 26, 9 setup uses exponential moving averages, or EMAs, which give more weight to recent observations:
- MACD line: the 12-period EMA of price minus the 26-period EMA.
- Signal line: a 9-period EMA of the MACD line, providing a smoother comparison.
- Histogram: the MACD line minus the signal line, displayed as bars.
- Zero line: a fixed reference separating positive and negative values.
The signal line averages MACD values, not the share price. The histogram measures the gap between the two indicator lines; it does not show trading volume.
TradingView’s MACD documentation explains these calculations and the configurable inputs. With the calculation timeframe set to Chart, 12 periods means 12 daily bars on a daily chart, or 12 weekly bars on a weekly chart.
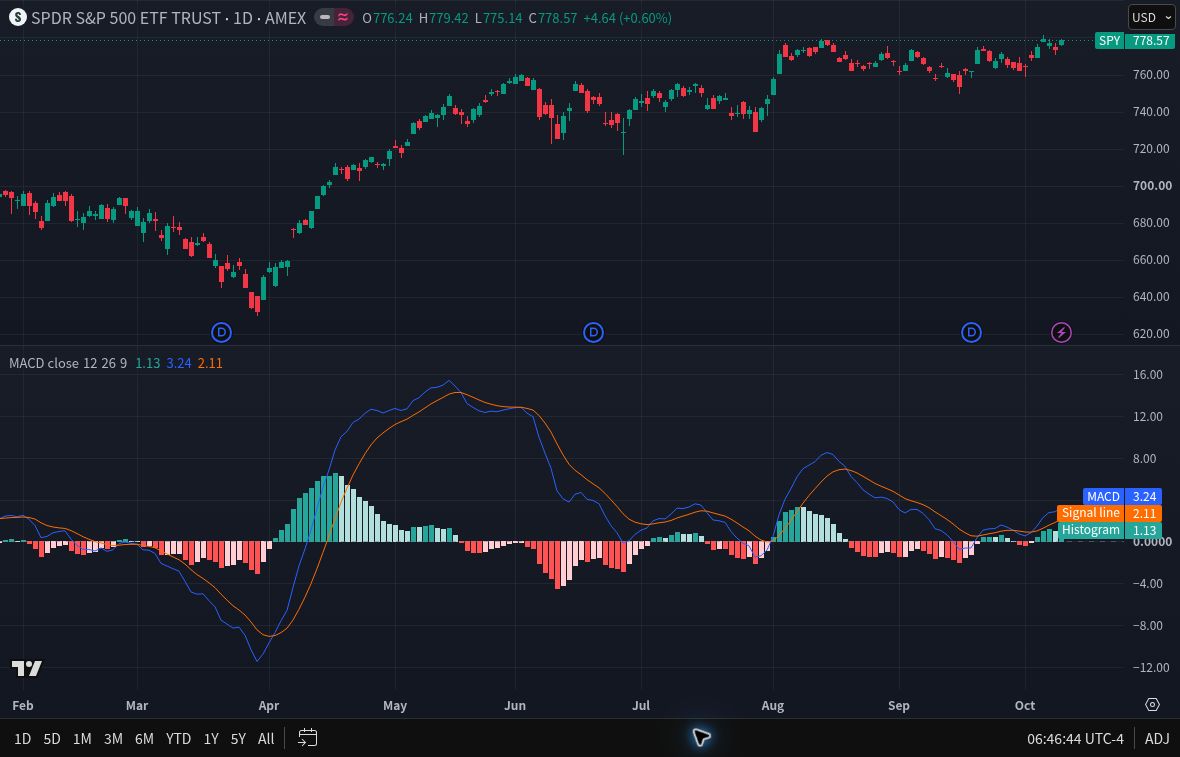
In this snapshot, the blue MACD line reads 3.24 and the orange signal line 2.11; their difference is approximately 1.13, matching the positive histogram. MACD is also above zero, which means the 12-period EMA is above the 26-period EMA. These readings describe this captured chart; they do not predict the next price move.
A small numerical example
Hypothetical example, not market data: suppose a stock’s 12-period EMA is $105 and its 26-period EMA is $103. MACD is therefore +2.00. If its signal line is +1.50, the histogram is +0.50.
On the next bar, suppose MACD rises to +2.10. With a 9-period EMA signal, the signal value becomes +1.62, leaving a histogram of +0.48.
The histogram has become smaller while MACD has increased. Its shrinking bars tell you the gap between MACD and its signal has narrowed. They do not, by themselves, establish that the stock’s price has started falling.
Two crossovers that answer different questions
A signal-line crossover occurs when MACD crosses its signal line. Moving above is commonly described as bullish; moving below as bearish. The histogram changes sign at the same crossover because it is the difference between those lines.
A zero-line crossover occurs when the MACD line crosses zero. Above zero, the fast price average exceeds the slow average. Below zero, it is lower. This is a different comparison from MACD versus its signal.
A bullish signal-line crossover can happen while MACD remains below zero. The shorter-term momentum reading may be improving even though the fast price average is still below the slow one. Fidelity’s MACD guide describes both crossover types and their limitations in trading ranges.
Read histogram values before their colors
Separate the bar’s position from its change since the previous bar:
- Positive and growing: MACD’s lead over its signal is widening.
- Positive and shrinking: that lead is narrowing.
- Negative and farther from zero: MACD is falling farther below its signal.
- Negative and closer to zero: that negative gap is narrowing.
In TradingView’s documented chart example, those four states appear as teal, pale teal, red and pale red, respectively. The MACD line is blue and the signal line orange. Your saved style may differ.
Check color assignments in the indicator’s Style tab rather than assuming a green bar means the share price rose. Keep the zero line visible.
MACD versus RSI: why the scale matters
MACD and RSI are both momentum oscillators. RSI uses a 0–100 scale. MACD has no fixed upper or lower boundary, so it has no universal equivalent of RSI’s 30 and 70 reference levels.
Our RSI 70/30 guide explains the bounded scale and why its reference levels are not automatic trading instructions.
MACD also retains the price units of its inputs. For a stock quoted in dollars, +2.00 represents a two-dollar difference between its moving averages, not 2%.
Consequently, raw MACD readings are unsuitable for ranking momentum across differently priced stocks. A larger number alone does not establish greater relative strength. StockCharts explains this price-scale limitation.
How to add MACD in TradingView
- Open a stock in Supercharts and choose a chart timeframe.
- Select Indicators on the upper toolbar, then search for MACD.
- Choose TradingView’s built-in indicator under Technicals, rather than a community variant or MACD Strategy.
- Open the indicator’s settings. For the standard setup, use Source: Close; Fast length: 12; Slow length: 26; Signal length: 9; Oscillator MA type: EMA; Signal MA type: EMA.
- Leave the indicator’s calculation timeframe set to Chart while learning. Use Style to inspect the lines, histogram and colors.
TradingView also permits SMA calculations for the oscillator and signal. Changing these choices changes the calculation. Its indicator setup guide explains where built-in indicators are located.
As checked on October 11, 2026, the Basic plan allows two indicators per chart. If you already use SMA and Volume, remove one before adding MACD. MACD’s lines and histogram belong to one indicator. Premium is not required for this exercise; consider a paid plan only if its additional capacity fits your needs.
Use MACD with price, fundamentals and risk
MACD uses historical averages, so it responds after price changes. In sideways markets, repeated crossovers can produce whipsaws: apparent signals that quickly reverse. A neat historical example is not evidence of a reliably profitable strategy.
For longer-term stock research, check whether the price is trending or moving sideways, then examine the company’s earnings, cash flow, debt and valuation. Our stock-analysis framework provides that business-research foundation. Position size, diversification and the loss you can tolerate still matter when an indicator looks favorable.
Before drawing a conclusion, record the symbol, timeframe, settings and whether the bar has closed. Compare both successful-looking and failed signals. This makes the exercise more useful than collecting only examples that worked.
If you later use a crossover as a reminder, read the TradingView alert setup guide for eligible conditions, bar-close timing, saved settings, and technical-alert plan limits.
For the broader routine around an indicator check, return to the weekly chart review guide.
Frequently asked questions
Does a shrinking MACD histogram mean the price will fall?
No. A positive histogram shrinking toward zero means the MACD–signal gap is narrowing. Price may still rise. Read the price chart alongside the indicator.
What do MACD settings 12, 26, 9 mean?
They specify the fast average’s length, the slow average’s length and the signal average’s length. With the standard EMA setup, the signal is a 9-period EMA of MACD.
Can I learn MACD on TradingView’s free plan?
Yes. Basic’s current two-indicator allowance is enough for MACD and one other indicator. Remove an existing indicator if necessary before adding it.
Affiliate disclosure: Stock Metric Lab may earn a commission through this TradingView affiliate link. The author uses Premium; the basic MACD exercise does not require it.
This article is educational and is not personalized investment advice. Indicators can fail, and investing involves the risk of loss.