
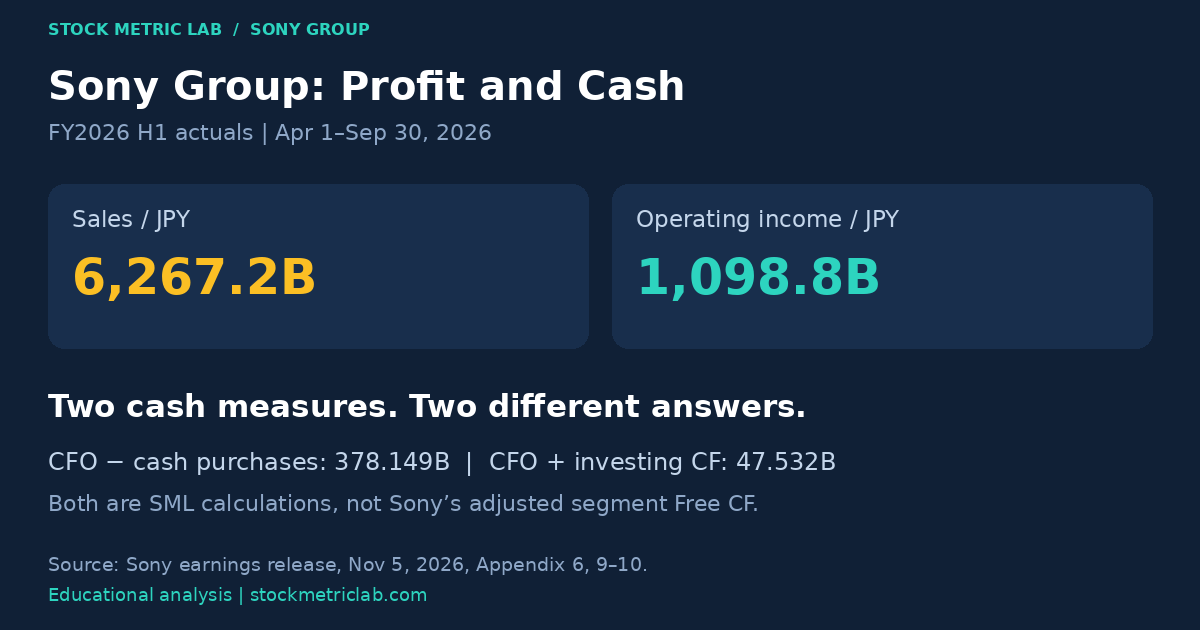
Data cutoff: November 8, 2026. Financial results cover July–September 2026 (Q2) and April–September 2026 (H1), released November 5. Sony calls the fiscal year ending March 31, 2027 FY2026. Cash-flow figures cover H1 unless otherwise stated; the latest buyback execution update covers October 31.
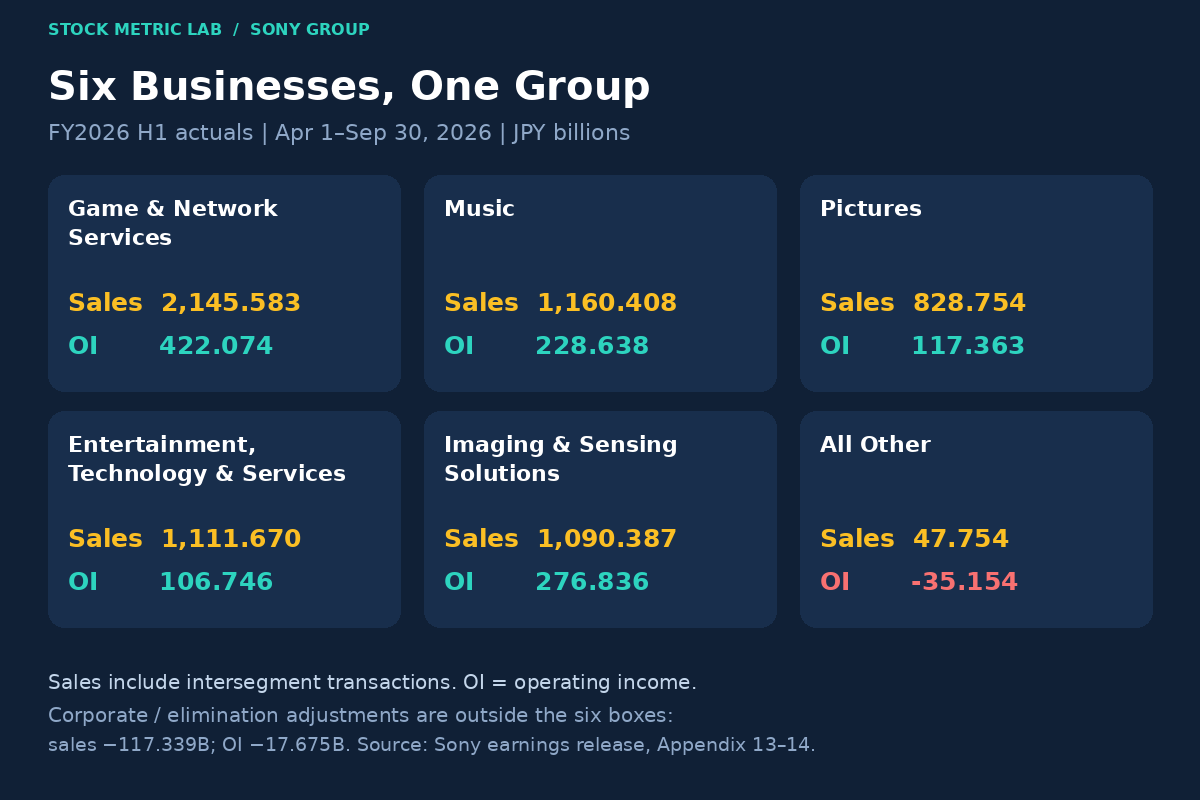
Sony combines a games platform, music rights, a film and television studio, consumer electronics and image sensors in one group. The businesses earn profits and consume cash differently. A useful analysis starts with the segments, then asks how much cash remains after content investment, equipment purchases and acquisitions.
The September quarter brought sales of ¥3,429.4 billion and operating income of ¥622.3 billion, up 10% and 45%, respectively. G&NS and Pictures supplied about 92% of the year-over-year increase in operating income, calculated from Sony’s unrounded segment figures. Yet reported growth needs context: gaming benefited from the absence of prior-year charges, and exchange rates supported consolidated sales. H1 operating cash flow rose, but acquisition-related spending made the choice of cash-flow measure particularly important. Sony’s November results presentation, PDF pages 2–4 and 8–12.
Thesis in One Minute
- Games and Pictures drove the quarterly profit increase. G&NS added ¥99.7 billion and Pictures ¥78.7 billion against a consolidated increase of ¥193.4 billion. A prior-year expense comparison and a successful film release contributed alongside ongoing business activity.
- Currency still matters. Q2 sales rose 10% in yen and approximately 4% on Sony’s constant-currency basis. The two rates answer different questions.
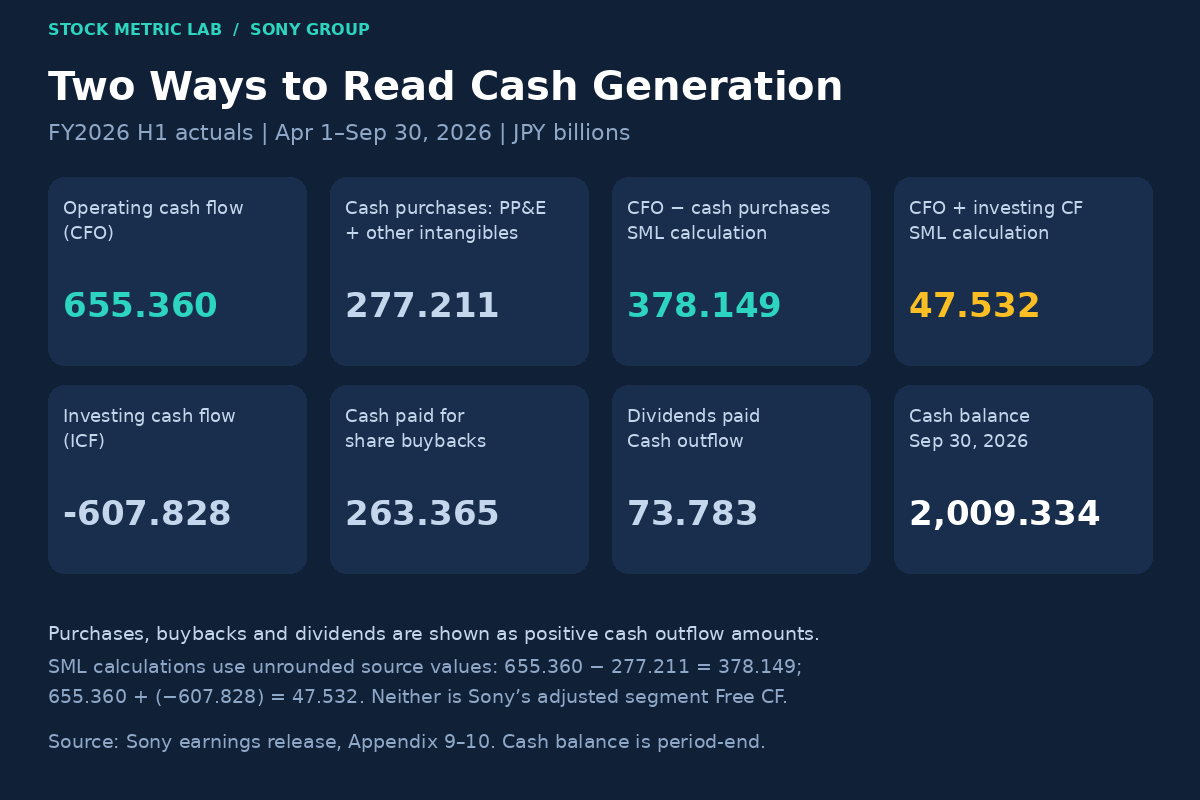
- H1 cash generation improved, with substantial investment outflows. Operating cash flow was ¥655.4 billion. SML calculates ¥378.1 billion after deducting cash purchases of property, plant, equipment and other intangible assets; adding all investing cash flow instead leaves ¥47.5 billion.
- Financial Services requires careful comparisons. Prior-year net income and EPS include both continuing-operations and total-operation presentations. The retained SFGI stake remains an asset even though it is no longer equity-accounted.
- Capital returns have advanced beyond the half-year snapshot. H1 cash payments for treasury stock were ¥263.4 billion. Separately, execution under the ¥500 billion authorization reached ¥309.0 billion by October 31, approximately 61.8% of the ceiling.
Listing and ADR. Sony Group trades on the Tokyo Stock Exchange under code 6758 and on the New York Stock Exchange through its SONY American Depositary Receipts. One ADR represents one ordinary share. The current depositary is JPMorgan Chase Bank, N.A. Verify current terms and fees with the depositary when using ADRs. Sony investor information and FY2025 Form 20-F, Item 9.
What Sony Makes
Game & Network Services (G&NS) includes PlayStation consoles, game software, add-on content and network services. Hardware shipments describe one part of the business; software spending and online activity provide another view of the platform.
Music spans recorded music, publishing, and visual media and platforms. Streaming and licensing support catalog revenue, while acquiring rights requires capital. The scale and timing of those investments matter to cash returns.
Pictures includes motion pictures, television production and media networks. The release schedule and performance of individual titles can cause large changes between quarters.
Entertainment, Technology & Services (ET&S) includes imaging products, sound, network services, displays and other electronics-related businesses. Product mix, demand and costs influence profitability across these categories.
Imaging & Sensing Solutions (I&SS) includes image sensors. It connects Sony to the smartphone cycle and to the capital-intensive economics discussed in SML’s semiconductor analysis framework.
All Other includes disc manufacturing, recording media and other activities. It is reported separately from corporate expenses and eliminations in the financial statements.
These descriptions follow the segment definitions in Sony’s financial statements, appendix page 18. Financial Services is presented as a discontinued operation in the historical comparisons, rather than as another current operating segment.
Segment Scoreboard for the Half Year
Sales in the following tables include intersegment transactions. Corporate and elimination adjustments reconcile them to consolidated sales. Operating income follows Sony’s segment reporting. Figures are ¥ billion, rounded from the financial statements.
| Segment | H1 sales | H1 operating income | Year-over-year OI change |
|---|---|---|---|
| Game & Network Services | 2,145.6 | 422.1 | +153.8 |
| Music | 1,160.4 | 228.6 | +20.5 |
| Pictures | 828.8 | 117.4 | +84.8 |
| Entertainment, Technology & Services | 1,111.7 | 106.7 | +2.6 |
| Imaging & Sensing Solutions | 1,090.4 | 276.8 | +84.3 |
| All Other | 47.8 | −35.2 | −27.3 |
| Corporate and eliminations | −117.3 | −17.7 | +11.2 |
| Consolidated | 6,267.2 | 1,098.8 | +329.9 |
The September quarter within that half year:
| Segment | Q2 sales | Q2 operating income | Year-over-year OI change |
|---|---|---|---|
| Game & Network Services | 1,208.5 | 220.1 | +99.7 |
| Music | 598.4 | 122.8 | +7.4 |
| Pictures | 513.7 | 92.6 | +78.7 |
| Entertainment, Technology & Services | 567.8 | 64.1 | +3.2 |
| Imaging & Sensing Solutions | 577.6 | 154.6 | +16.4 |
| All Other | 25.6 | −21.9 | −19.0 |
| Corporate and eliminations | −62.2 | −9.9 | +7.0 |
| Consolidated | 3,429.4 | 622.3 | +193.4 |
Rounding can prevent displayed rows from adding exactly to totals. Financial statements, appendix pages 11–14.
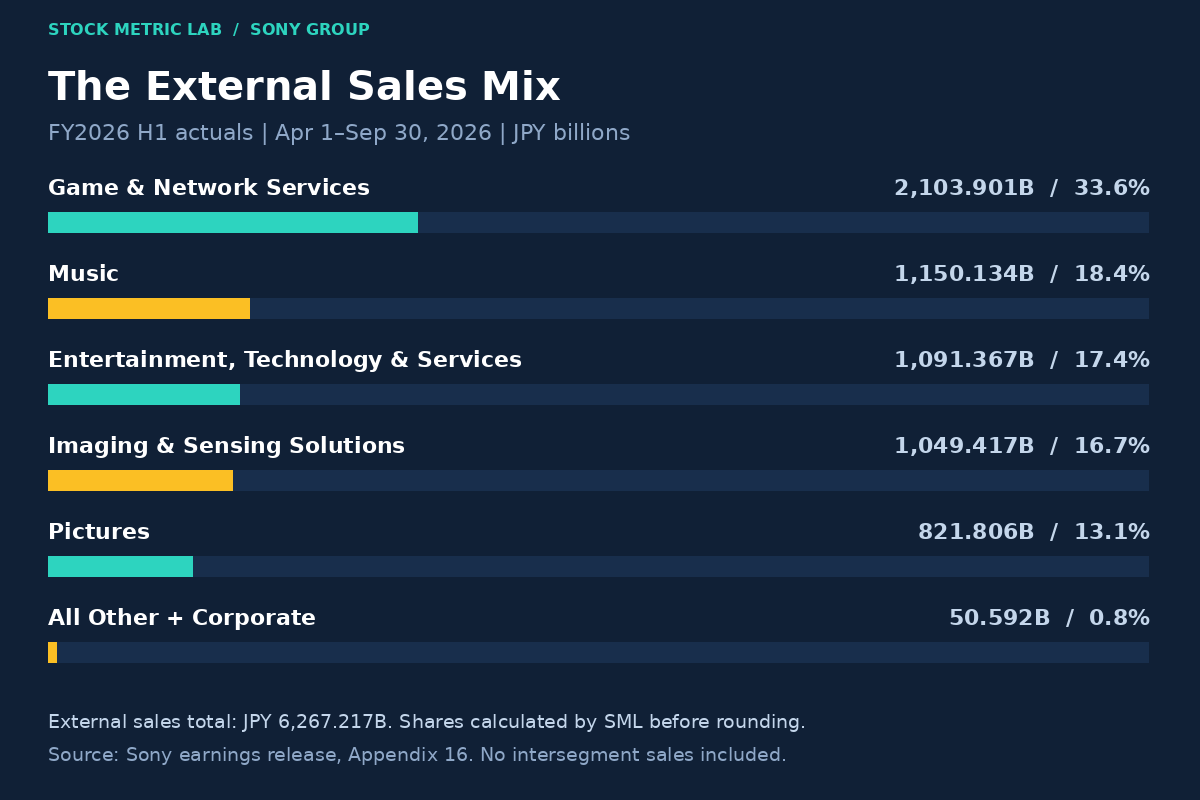
For the revenue mix, external-customer sales are the appropriate denominator. H1 external sales were ¥2,103.9 billion for G&NS, ¥1,150.1 billion for Music, ¥821.8 billion for Pictures, ¥1,091.4 billion for ET&S, ¥1,049.4 billion for I&SS and ¥41.2 billion for All Other. Corporate external sales contributed a further ¥9.4 billion. These amounts sum to consolidated revenue before rounding; they differ from the intersegment-inclusive table above. Financial statements, appendix page 16.
Latest Results and the Comparison Basis
| Metric | Q2 July–September 2026 | Year over year | H1 April–September 2026 | Year over year |
|---|---|---|---|---|
| Sales | ¥3,429.4B | +10% | ¥6,267.2B | +9.4% |
| Operating income | ¥622.3B | +45% | ¥1,098.8B | +42.9% |
| Operating margin, SML calculation | 18.1% | Prior year 13.8% | 17.5% | Prior year 13.4% |
| Income before income taxes | ¥623.2B | +41% | ¥1,100.6B | +37.9% |
| Attributable net income | ¥449.6B | +44% | ¥791.8B | +38.8% |
| Basic / diluted EPS | ¥76.88 / ¥76.49 | Prior year ¥52.03 / ¥51.71 | ¥134.89 / ¥134.30 | Prior year ¥95.09 / ¥94.51 |
Net-income growth and prior-year EPS in this table use continuing operations. Q2 growth rates follow Sony’s rounded presentation; H1 growth rates follow its financial summary. Margins are SML calculations using unrounded amounts. Attributable net income means income attributable to Sony Group Corporation’s stockholders. Financial statements, cover and appendix pages 4 and 6.
For comparison, prior-year total attributable net income, including discontinued Financial Services, was ¥362.0 billion in Q2 and ¥598.9 billion in H1. Comparing the current figures against those totals gives growth of 24.2% and 32.2%, respectively, by SML calculation. Sony reports both scopes; they must not be mixed in a single growth comparison.
Currency supported reported growth. The Q2 average exchange rates were ¥159.3 per US dollar and ¥183.4 per euro, versus ¥147.4 and ¥172.2 a year earlier. Sony’s approximately 4% constant-currency revenue growth provides additional context to the 10% yen growth. Constant currency is a supplementary analytical measure, not a replacement for the IFRS results. Presentation, PDF pages 2–3 and 18.
Games and Pictures Explain Much of the Increase
G&NS operating income rose approximately 83% to ¥220.1 billion. Part of the comparison reflects the absence of ¥31.5 billion of Bungie impairment losses and ¥18.3 billion of expenses correcting previously capitalized development costs recorded in the prior-year quarter. Sony also identifies network services and first-party game sales as profit drivers. Those prior-year charges are comparison effects, not new cash inflows or current-period reversals. Presentation, PDF page 8.
PS5 hardware sell-in was 2.6 million units, down from a revised 4.0 million in the prior-year quarter. Full-game software sales for PS4 and PS5 combined were 88.2 million units, including 8.2 million first-party titles; the digital download ratio was 78%. September monthly active users were 127 million, versus 119 million a year earlier. That measure estimates unique accounts active online during the last month of the quarter, not paying subscribers. Sony corrected the prior-year Q2 hardware figure from 3.9 million to 4.0 million in its latest supplement. Supplemental information, page 11.
Pictures earned ¥92.6 billion, compared with ¥13.9 billion a year earlier. Sony identifies higher Motion Pictures revenue, primarily theatrical revenue from Spider-Man: Brand New Day, as a driver. Reported segment sales increased 48% in yen and 37% in US dollars. The distinction matters because Sony analyzes this segment on a dollar basis. Film-release timing makes a single quarter a limited basis for judging sustainable profit. Presentation, PDF page 12.
Music operating income increased to ¥122.8 billion. Streaming revenue and foreign exchange helped profit, while lower Visual Media & Platform revenue weighed on it. ET&S earned ¥64.1 billion, with US tariff refunds supporting profit despite weaker sales. The sources distinguish those drivers from the G&NS comparison effects. Presentation, PDF pages 10 and 14.
Image Sensors and the Updated Earthquake Assessment
I&SS Q2 revenue declined 6% to ¥577.6 billion, while operating income increased 12% to ¥154.6 billion. Its 26.8% operating margin was the highest among Sony’s five main segments, calculated by SML using intersegment-inclusive sales. H1 segment sales were ¥1,090.4 billion and operating income ¥276.8 billion.
Lower mobile-sensor unit sales weighed on revenue, partly offset by product mix and currency. Sony estimates a ¥25.9 billion positive currency effect on quarterly I&SS operating income, larger than the ¥16.4 billion reported increase. The profit gain therefore should not be read as evidence of stronger unit demand. Presentation, PDF page 16.
Sony raised its full-year I&SS operating-income forecast from ¥420 billion to ¥450 billion, on sales of ¥2,120 billion. Cost reductions and currency helped the revision, while earthquake effects weighed on it. In its November remarks, Sony said the Kumamoto Technology Center had recovered to pre-earthquake operating levels. It incorporated approximately ¥16.0 billion of losses into the fiscal-year forecast, primarily relating to work-in-progress inventory damage, equipment repairs and lost production opportunities. This updates the July assessment, when the impact had not yet been included in guidance. Presentation, PDF page 17; speech transcript, PDF page 22.
Memory supply, high-end handset pricing and customer product cycles remain watch items. Sony expects the balance of mobile-sensor shipments between the first and second halves to differ from previous years. The H1 result should not simply be doubled to estimate full-year sensor earnings.
Cash Flow and the Cost of Acquisitions
The published cash-flow statement covers the six months through September. It does not provide a standalone July–September statement. The following amounts use continuing operations, with outflows in parentheses.
| H1 cash-flow measure | ¥B |
|---|---|
| Operating cash flow | 655.4 |
| Cash purchases of PP&E and other intangible assets | (277.2) |
| Operating CF less those purchases, SML calculation | 378.1 |
| Investing cash flow | (607.8) |
| Of which, purchases of businesses and other | (314.1) |
| Operating plus investing CF, SML calculation | 47.5 |
| Financing cash flow | (229.3) |
| Cash and cash equivalents at September 30 | 2,009.3 |
Source: Financial statements, appendix pages 9–10. The cash balance is a period-end stock, not a six-month flow.
Start with the exact operands. Operating cash flow was ¥655,360 million. Subtracting ¥277,211 million of cash purchases of PP&E and other intangible assets produces SML’s narrower free-cash-flow calculation of ¥378,149 million. Adding investing cash flow of negative ¥607,828 million instead gives ¥47,532 million. The ¥330,617 million difference consists of net investing movements outside that single purchase line. Rounding the displayed billions before calculating would give different last digits.
Acquisition spending explains much of the gap. The ¥314,117 million purchases-of-businesses-and-other line includes a July 15 acquisition by a Music subsidiary. Sony reports cash consideration of ¥256,381 million and, after acquired cash, a net investing outflow of ¥239,866 million for that transaction. The deal was accounted for as an acquisition of assets rather than a business. It added ¥542,652 million of music-catalog content assets and ¥308,721 million of secured long-term debt. Calling the entire ¥314.1 billion line a single catalog purchase would overstate the deal’s cash cost. Financial statements, appendix page 18.
Profit and operating cash both rose, at different rates. Continuing operating cash flow increased approximately 33.1%, from ¥492.3 billion to ¥655.4 billion, while operating income rose 42.9%. H1 income-tax payments were ¥252.0 billion; changes in content assets and inventories reduced operating cash flow by ¥352.5 billion and ¥240.9 billion. These are cash-flow-statement adjustments. They differ from the changes in balance-sheet asset balances, which can also reflect acquisitions, currency and other movements.
Define the purchase line precisely. The cash purchase line covers PP&E and other intangible assets. It is not the same as the supplement’s additions-to-long-lived-assets measure, and it does not capture all spending on content. Content-related cash movements appear within operating cash flow, while the catalog transaction above appears within investing cash flow. SML’s narrower calculation therefore leaves acquisition spending outside its deduction. This is a limitation readers should keep in mind when using a free-cash-flow framework.
Keep Sony’s own Free CF separate. The supplement presents company-defined segment Operating CF, Investing CF and Free CF for FY2025, the year ended March 31, 2026. Its Free CF total is ¥1,182.1 billion. Segment cash flows exclude restricted-cash movements from operating CF, exclude fixed-term-deposit movements from investing CF, and include lease expenditure in investing rather than financing CF, with reconciliation adjustments. That company table is not a reported H1 FY2026 Free CF measure. Neither H1 calculation in this article should be described as Sony’s published Free CF or as an exact reproduction of its adjusted segment definition. Supplemental information, page 7.
Content assets at September 30 were ¥3,156.4 billion, up from ¥2,558.6 billion at March 31. Future streaming, licensing and other content receipts will determine the returns on that larger asset base; the balance alone does not establish those returns.
Capital Returns and the Latest Execution Update
The May 8, 2026 authorization permits repurchases of up to 230 million shares for up to ¥500 billion between May 11, 2026 and May 10, 2027. According to Sony’s November 5 status notice, cumulative execution through October 31 reached 86,065,800 shares for ¥308,962,118,545, approximately 61.8% of the cash ceiling by SML calculation. October purchases alone were ¥45.6 billion. An authorization remains a maximum, not a promise to spend the balance. Latest repurchase status.
The H1 cash-flow statement separately records ¥263.365 billion paid for treasury stock and ¥73.783 billion of dividends paid. Cash-flow payment amounts and authorization execution totals have different reporting bases and cutoffs, so they should not be treated as one series.
Repurchase and cancellation also have different effects. Repurchases reduce shares outstanding excluding treasury stock from their acquisition dates and affect the weighted-average EPS denominator accordingly. Cancellation is the subsequent reduction in issued shares. The H1 statement separately records cancellation within equity; it is not another cash outflow to add to repurchases. Share-based compensation can also affect the share count.
The interim dividend is ¥17.50 per share, with payment scheduled to commence December 4, 2026. The year-end forecast is ¥17.50, bringing the annual forecast to ¥35, unchanged in November. This compares with ¥25 for the prior year, excluding the separate in-kind spin-off distribution. Financial statements, cover, dividend summary and appendix pages 8–10.
Full-Year Forecast
Forecast, not completed results. Sony’s November 5 outlook for the year ending March 31, 2027 is:
| Measure, ¥B | July forecast | November forecast |
|---|---|---|
| Sales | 12,500 | 13,000 |
| Operating income | 1,720 | 1,870 |
| Income before income taxes | 1,710 | 1,860 |
| Attributable net income | 1,210 | 1,330 |
| Operating cash flow | 1,500 | 1,600 |
The ¥150 billion operating-income revision is 8.7% by SML calculation. Sony’s presentation rounds it to 9%. November segment forecasts are:
| Segment | Sales forecast, ¥B | Operating-income forecast, ¥B |
|---|---|---|
| G&NS | 4,830 | 700 |
| Music | 2,300 | 445 |
| Pictures | 1,760 | 200 |
| ET&S | 2,250 | 150 |
| I&SS | 2,120 | 450 |
| All Other, corporate and eliminations | Not shown here | −75 |
Second-half exchange-rate assumptions are approximately ¥153 per US dollar and ¥175 per euro. These assumptions and the operating outlook may change. Sony does not provide a forecast EPS in these materials. Presentation, PDF pages 5–7.
Risks and Watch Items
- Currency: the gap between reported and constant-currency revenue growth, and the sensor profit sensitivity, show why exchange-rate effects deserve separate attention.
- Gaming comparisons: the absence of prior-year charges explains part of Q2 profit growth. Network activity, software revenue and hardware economics should be followed alongside reported operating income.
- Film timing: the Pictures improvement includes a successful theatrical release. Quarterly earnings depend on the slate and associated spending.
- Sensor demand: memory availability, handset pricing, inventories and customer launch cycles can change both volumes and shipment timing.
- Content investment: catalog purchases add assets and sometimes debt before their full cash returns are visible. Follow operating cash generation and acquisition spending together.
- Production concentration: Sony reports recovery at Kumamoto, but the ¥16.0 billion forecast impact illustrates the financial exposure to disruption at major manufacturing sites.
- Capital returns: compare buybacks and dividends with cash generation, investment needs and debt obligations. A repurchase ceiling is not a completed distribution.
Weekly Market Chart
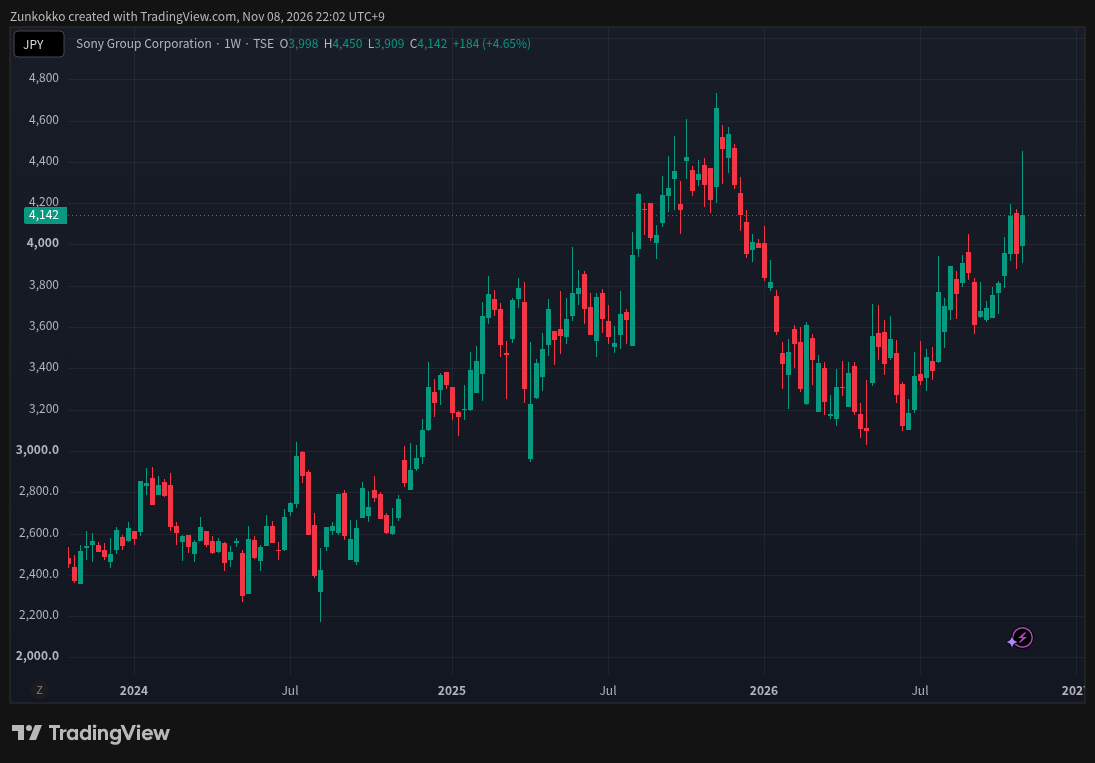
This chart provides historical market context. TradingView adjusts historical stock prices for splits, and dividend adjustment is enabled here. Adjusted historical values are not necessarily the prices originally traded on those dates. The chart is not a valuation estimate or a trading signal.
Valuation Framework Without a Live Price
The weekly chart above is a dated historical snapshot, not a live quote. This analysis does not calculate a current market capitalization or trading multiple. Sony’s business mix makes the assumptions behind a valuation particularly important.
A sum-of-the-parts approach can distinguish platform services, music rights, film production, electronics and semiconductors. Use a consistent earnings period and account for corporate costs and eliminations rather than simply summing the main segments. The retained SFGI investment should be treated separately from current operating-segment profits.
For a consolidated approach, the ¥1,330 billion attributable-net-income forecast supplies a company outlook, not a guaranteed earnings base. Currency assumptions, release timing, demand and exceptional comparison effects should inform sensitivity analysis. Cash conversion and acquisition spending provide another check on the earnings picture.
Reader Checklist
Frequently Asked Questions
Is Sony a semiconductor stock?
Image sensors are a substantial part of Sony, but they are one of several businesses. I&SS produced ¥276.8 billion of H1 operating income, while G&NS produced ¥422.1 billion and Music ¥228.6 billion. A semiconductor-only valuation would leave much of the group unexplained.
What happened to Sony Financial Group?
Sony classified Financial Services as discontinued from April–June 2025 and executed the partial spin-off on October 1, 2025. Following SFGI’s June 25, 2026 shareholder meeting, Sony concluded that it no longer had significant influence. The retained stake moved from equity-method accounting to an equity instrument measured at fair value through other comprehensive income. Historical comparisons still require continuing-versus-total scope discipline. Financial statements, cover and appendix pages 18–19.
Why are there two H1 cash calculations?
SML’s ¥378.1 billion calculation deducts cash purchases of PP&E and other intangible assets from operating cash flow. Its ¥47.5 billion calculation adds all investing cash flow, capturing acquisition and other investment movements as well. Both use H1 reported inputs, but neither is a Sony-reported H1 Free CF line. Sony’s own segment Free CF table shown in the latest supplement covers FY2025 and uses adjustments described above.
Did operating cash flow fall despite higher profit?
Not in H1. Continuing operating cash flow rose approximately 33.1%, compared with 42.9% operating-income growth. Tax payments, content and inventory movements help explain why the two measures grow at different rates. The weaker Q1 cash-flow comparison should not be carried forward as a description of the half year.
When does Sony report next?
The results analyzed here were released November 5, 2026. Sony’s published schedule lists the Q3 announcement for February 4, 2027 (Thursday, Japan time). The company notes that dates may change. Check the official IR schedule for updates.
Primary Sources and Methodology
Primary materials were checked November 8, 2026. All reported amounts come from Sony; ratios and cash measures marked SML calculation use the source’s unrounded inputs. Displayed billions are rounded, so displayed tables may not add exactly. The weekly chart is a dated historical snapshot; no current valuation is calculated from its price. No consensus estimates are used.
- Financial statements for the six months ended September 30, 2026: appendix pages 2–3 balance sheet; 4 and 6 income statements; 8–10 equity and cash flow; 11–16 segment and external-customer sales; 17–19 EPS, acquisition and SFGI notes.
- Q2 FY2026 results presentation: consolidated results, currency effects, forecasts and segment drivers. Page references in the article count the cover as PDF page 1.
- Q2 FY2026 speech transcript: management’s operating assessment, including Kumamoto recovery and forecast loss on PDF page 22.
- Supplemental information: page 7 company-defined historical segment cash flows; page 11 PS5 units, software and monthly active users.
- Sony investor information and FY2025 Form 20-F, Item 9: current ADR listing, depositary and share ratio.
- FY2026 IR schedule, published April 8, 2026: Q3 announcement planned for February 4, 2027, subject to change.
- November 5 share-repurchase status: execution through October 31, 2026 and the existing authorization.
This article is for educational and informational purposes only. It is not investment, financial, tax, legal or accounting advice, and it is not a recommendation to buy, sell or hold any security. Verify current filings and market information before making an investment decision.