
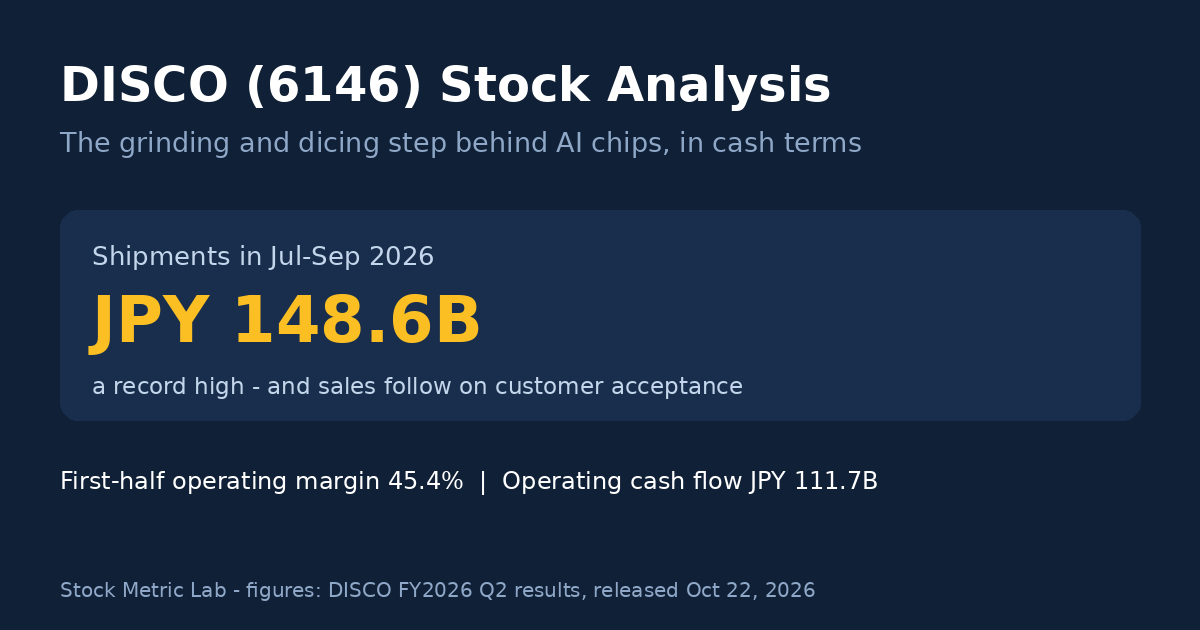
Company: DISCO Corporation (株式会社ディスコ) Exchange: Tokyo Stock Exchange Prime Market, code 6146 Period covered: First half of the fiscal year ending March 31, 2027 (April 1 to September 30, 2026), Japanese GAAP, consolidated Results released: October 22, 2026
An AI chip passes through a pair of unglamorous steps near the very end of its manufacture. After the front-end factories have printed the circuits, the wafer is still thick — so it is ground down to a fraction of its original thickness, and then cut into individual dies. DISCO Corporation makes the machines that do that grinding and cutting, and — just as important — the blades and wheels those machines consume. Its latest half-year shows what that position is worth in cash: sales of ¥257.1 billion, an operating margin of 45.4%, and ¥111.7 billion of operating cash flow against ¥12.9 billion of equipment purchases.
This analysis reads DISCO the way SML reads every equipment maker: shipments first, because DISCO’s own disclosure leads with them; then the acceptance-based sales that follow; then the cash.
The Thesis in One Minute
- DISCO holds the back-end corner of the semiconductor equipment map. Tokyo Electron’s machines build the circuits (front-end); DISCO’s grinders and dicing saws thin and separate the finished wafer (back-end processing). Test is not a single step at the end of that chain: Advantest’s testers work at the wafer stage — before DISCO’s machines — and again on packaged devices after them. Together, these businesses illustrate different stages of the manufacturing chain.
- The business has two layers. Precision processing equipment — dicers and grinders — was 63% of shipment value in July–September 2026 and moves with customers’ capacity spending. Precision processing tools — the blades and wheels the machines use up — were 23% and hit a record high, because they track how hard customers run the machines they already own.
- Demand is currently powered by generative AI: the company attributes the growth to advanced logic and HBM-related investment, plus growth in CPO-related applications for its dicers.
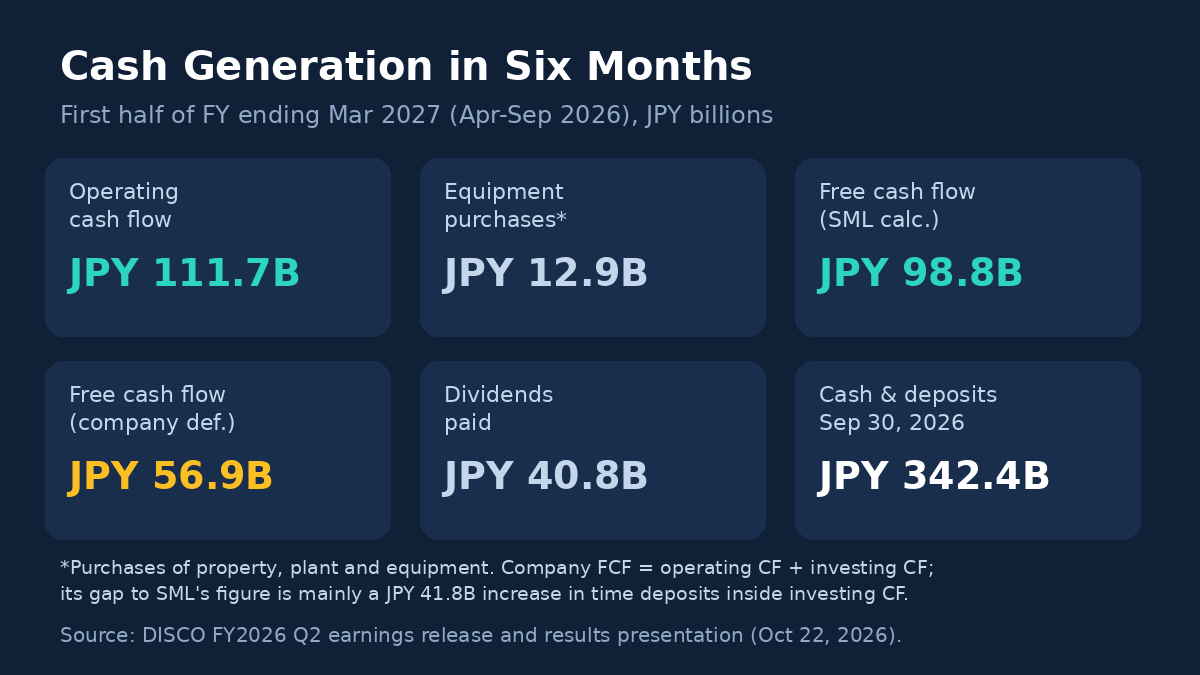
- The cash profile is unusually light. First-half operating cash flow was ¥111.7 billion; purchases of property, plant and equipment were ¥12.9 billion. SML’s free cash flow (operating cash flow minus those purchases) is ¥98.8 billion. The company’s presentation reports approximately ¥56.9 billion of free cash flow. The gap to SML’s figure is mainly a ¥41.8 billion increase in time deposits, explained below.
- Dividends follow a stated formula: DISCO targets dividends of 25% of consolidated half-year net income, with a floor. The interim dividend for this fiscal year is ¥186 per share, up from ¥129. No buyback is disclosed in the half-year materials — and the company’s policy-level mention of buybacks as a possible return method is a policy statement, a separate matter from the period’s record (see Capital Returns).
What DISCO Actually Makes
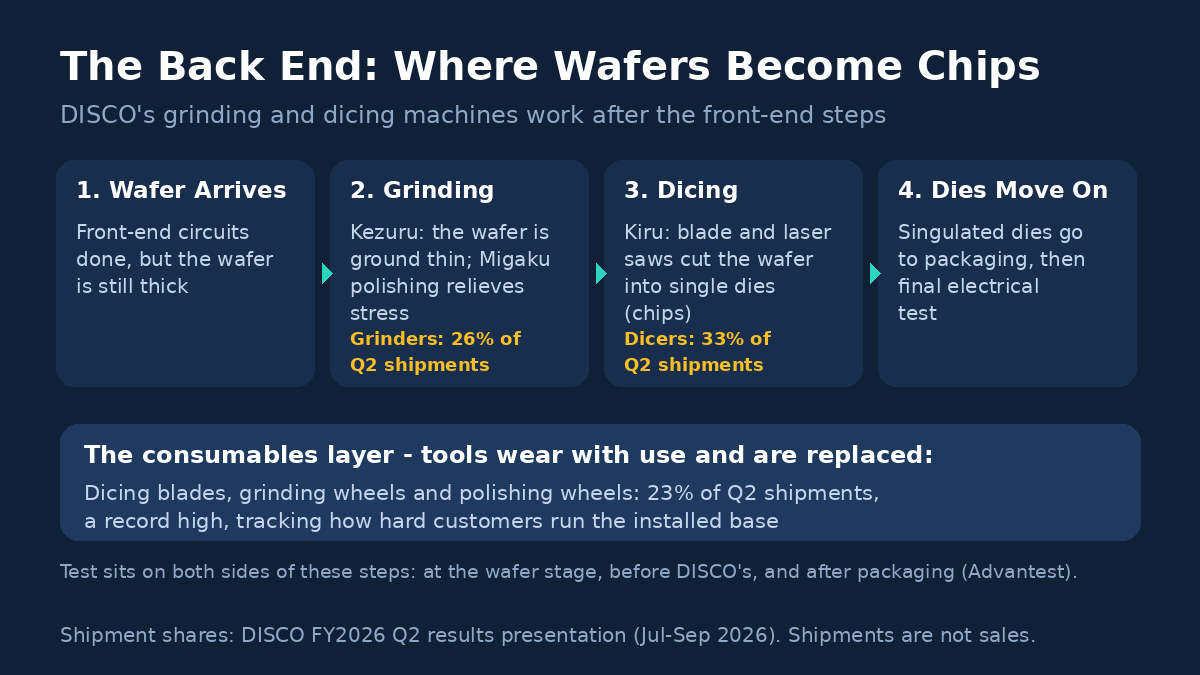
DISCO describes its craft with three Japanese verbs: Kiru (cutting), Kezuru (grinding) and Migaku (polishing). The company was founded in 1937 as a maker of abrasive grinding wheels, and the modern business is that origin, industrialized: it sells both the precision machines that cut, grind and polish, and the consumable tools — diamond blades and wheels — that do the actual work and wear out.
The product map, in the company’s own grouping:
- Precision processing equipment (63% of July–September 2026 shipments). Dicing saws (33% of shipments), which cut a wafer into individual dies — blade dicers (18%) for the classic mechanical cut, and laser saws (15%) for materials and structures a blade handles poorly. Grinders (26%), which thin wafers from the back side (back-grinding) and polish away grinding stress. Accessory equipment (4%) around those core processes.
- Precision processing tools (23% of shipments). The consumables: dicing blades, grinding wheels, polishing wheels — tens of thousands of specifications, matched to each customer’s material and process, replaced continuously as they wear.
- Others (14% of shipments). Including products of group companies, as the company groups them.
Where the products go matters more than the product list. In the same quarter, 73% of dicer shipments were for IC applications and 10% for optical semiconductors. The company separately said CPO-related optical-semiconductor and optical-component applications grew; it did not disclose a CPO-only shipment share. Grinder shipments were 77% for ICs and 7% for wafer manufacturing itself. On a sales (acceptance) basis, 78% of the quarter’s revenue was in Asia — China 31% (including local factories of foreign manufacturers), Taiwan 26%, Korea 11%, Singapore 8% — with Japan at 10%.
DISCO is a single-segment company: there is no segment profit table to dissect. Product and application shares above are on a shipment basis; the geographic percentages are on a sales (acceptance) basis. The niche itself — dicing and grinding — is one DISCO describes, in its investor materials, as a field where its initiatives have produced high market share and high profitability. The company does not publish a current market-share figure in its earnings materials, so this article prints none. What can be verified is the economics the niche produces, and those are in the results below.
Two Revenue Layers: Machines and the Blades They Consume
The most useful way to read DISCO is as two businesses sharing one factory gate.
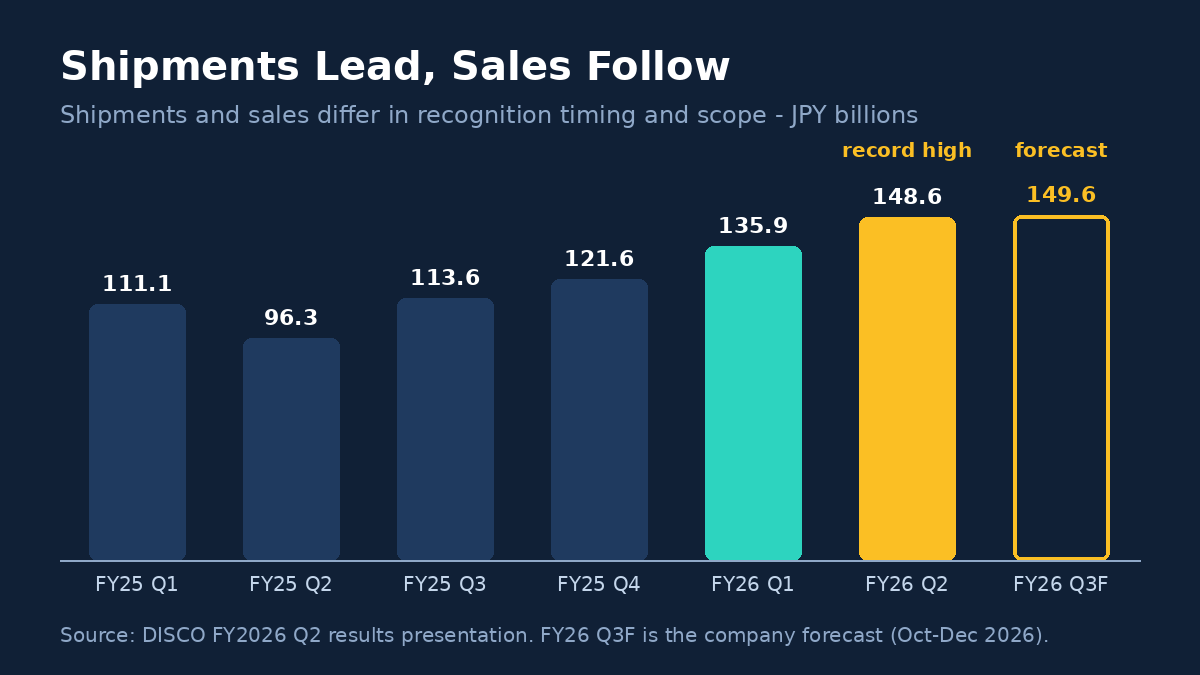
The equipment layer (63% of the quarter’s shipments) is a capital-goods business. A dicer or grinder is bought when a chip maker adds capacity or changes process — for thinner wafers, larger packages, new materials. Orders arrive in waves tied to customers’ investment cycles, and the shipment series below shows the wave pattern plainly: DISCO’s quarterly shipments fell from ¥111.1 billion to ¥96.3 billion between the first and second quarters of fiscal 2025 before climbing to this year’s record. Equipment revenue is real, but it is cyclical revenue.
The tools layer (23% of shipments) behaves differently. A blade or wheel is consumed in use; a customer running its installed DISCO machines harder buys more of them, automatically, without any new capacity decision. In July–September 2026, tool shipments rose 24% quarter on quarter and 45% year on year to a record high — the company’s own explanation is customer equipment utilization. For a reader, that makes tool shipments the cleanest utilization gauge DISCO discloses: they say the installed base is not just installed, it is busy.
The teaching point generalizes across the equipment cluster. Tokyo Electron’s recurring layer is Field Solutions — parts and services on its installed base. DISCO’s is physical consumables, replaced by wear rather than by service contract. Advantest’s is services and support on its testers. These recurring layers depend more on use of the installed base than new capacity purchases, but remain exposed to utilization declines. In a downturn, the question is whether the recurring layer held up.
Shipments: The Number DISCO Wants You to Watch First
DISCO headlines a figure most equipment makers do not disclose at all: shipments (出荷額), the value of products shipped during the period. It is not sales. DISCO recognizes equipment sales on customer inspection and acceptance, which can occur after shipment — the earnings release attributes this half’s sales growth to “progress in equipment inspection/acceptance”. The presentation’s balance-sheet notes add the cash side of the same arrangement: contract liabilities, which rose from ¥50.0 billion at March 31, 2026 to ¥79.6 billion at September 30, 2026, include amounts associated with payment upon shipment. For equipment paid for upon shipment, DISCO can receive cash before recognizing revenue on customer acceptance. The timing of collections and revenue recognition varies with the transaction.
That makes the quarterly shipment series the single best cycle gauge in this article:
| Quarter | Shipments (¥bn) |
|---|---|
| FY2025 Q1 (Apr–Jun 2025) | 111.1 |
| FY2025 Q2 (Jul–Sep 2025) | 96.3 |
| FY2025 Q3 (Oct–Dec 2025) | 113.6 |
| FY2025 Q4 (Jan–Mar 2026) | 121.6 |
| FY2026 Q1 (Apr–Jun 2026) | 135.9 |
| FY2026 Q2 (Jul–Sep 2026) | 148.6 — record high |
| FY2026 Q3 forecast (Oct–Dec 2026) | 149.6 |
Source: DISCO FY2026 Q2 results presentation. The last row is the company’s forecast for the quarter, not a result; it appears in the forecast block below as well.
For the first half as a whole, shipments were ¥284.6 billion, up 37.2% year on year, against sales of ¥257.1 billion. The ¥27.5 billion difference (SML arithmetic) is a gap between two flows measured over the same six months — shipment value versus reported revenue within that window. It is not the same number as the contract-liabilities balance: that balance is a stock at September 30 (¥79.6 billion), it also reflects whatever was already in the pipeline when the half began, and only part of it is cash collected at shipment. Nor does the gap convert yen-for-yen into future sales — acceptance schedules, mix and timing all intervene. The positive gap is consistent with shipments running ahead of revenue recognition, but these aggregate figures do not by themselves measure the change in unaccepted equipment. If shipments weaken, that can put pressure on later sales; the size and timing depend on customer acceptance and product mix. SML’s framework for analyzing semiconductor equipment stocks makes the same point in general form — never confuse bookings, backlog, shipments and revenue — and DISCO is the company that discloses enough to apply it literally.
Latest Results: A Record First Half
The six months to September 30, 2026, on a Japanese GAAP consolidated basis:
| First half FY2026 (Apr–Sep 2026) | ¥m | Year on year |
|---|---|---|
| Shipments | 284,584 | +37.2% |
| Net sales | 257,058 | +32.1% |
| Gross profit | 183,917 | margin 71.5% |
| Operating income | 116,639 | +47.9% (margin 45.4%) |
| Ordinary income | 114,437 | +44.0% |
| Net income attributable to owners of the parent | 80,366 | +43.7% |
| EPS — basic / diluted | ¥740.84 / ¥738.72 |
The standalone second quarter (July–September 2026), from the presentation’s own quarterly table: sales ¥142.8 billion (+36.4%, a quarterly record per the company), operating income ¥67.6 billion (+52.3%, a 47.4% margin), net income ¥46.1 billion (+43.5%).
Three reading notes, in the order a careful reader meets them:
- Operating income is the clean line this half. Ordinary income is lower than operating income — unusual enough to check. The income statement shows ¥3,101 million of foreign-exchange losses in non-operating expenses, partly offset by ¥846 million of interest income. Nothing about the core business deteriorated between the two lines; the yen moved. (The Advantest analysis makes the mirror-image point: there, a valuation gain flattered pre-tax income. In both cases, operating income is the line to anchor on.)
- The margin structure is the niche, expressed in numbers. A 71.5% gross margin and a 45.4% operating margin, at ¥257 billion of half-year sales, is what a defensible processing niche plus a consumables stream looks like. DISCO evaluates business quality against through-cycle standards — its investor materials set a four-year consolidated ordinary income margin of 20% or more, and a four-year RORA (return on risk assets) of 20% or more, as its business-quality indexes — but those standards do not establish that this half is the cycle peak. They support testing whether current margins are sustainable.
- The balance sheet is a fortress with one visible future outflow. Total assets were ¥824.6 billion and net assets ¥629.0 billion (equity ratio 76.1%); non-current liabilities were roughly ¥1 billion — the balance sheet carries essentially no debt. Cash and deposits stood at ¥342.4 billion. Against that, income taxes payable rose to ¥31,814 million at September 30, from ¥22,523 million at the fiscal year-end: a known future cash outflow sitting inside the fortress. Inventories rose to ¥160.8 billion, consistent with the shipment pipeline described above — and the line to watch if acceptances slow.
Outlook — company forecast, not results
DISCO does not publish a full-year forecast. What it published on October 22, 2026, kept separate from everything above:
- Nine-month cumulative forecast (April–December 2026): net sales ¥389,500 million (+28.2%), operating income ¥174,700 million (+38.4%), ordinary income ¥173,400 million, net income ¥121,900 million (+31.6%), EPS ¥1,123.43; shipment value ¥434,200 million (+35.2%).
- Third-quarter standalone forecast (October–December 2026): net sales ¥132.4 billion, operating income ¥58.1 billion (43.9% margin), net income ¥41.5 billion, shipments ¥149.6 billion, on assumed rates of ¥151 to the dollar and ¥173 to the euro. The company also guided shipment direction by category versus the September quarter: equipment +5% (grinders +10%, dicers slightly down), tools −5%, others −10%.
- Full-year investment plans (fiscal 2026): capital expenditure of roughly ¥33.0 billion, depreciation of roughly ¥16.0 billion and R&D of roughly ¥38.0 billion.
The nine-month forecast implies a third quarter slower than the record second on sales and profit, even with shipments guided slightly higher. The company does not attribute that gap to a single cause, and neither does this article: acceptance timing is one possible factor, alongside the company’s own guided sequential dips in tool shipments (−5%) and other shipments (−10%), product mix, and the simple fact that the comparison base is a record quarter. Treat every figure in this block as the company’s plan as of October 22, 2026, not as a result.
Cash Flow: Two Free-Cash-Flow Numbers, One Bridge
First-half cash flow, from the release’s cash-flow statement:
| First half FY2026 (¥m) | |
|---|---|
| Operating cash flow | 111,708 |
| Purchases of property, plant and equipment | (12,896) |
| Free cash flow — SML definition (OCF − PP&E purchases) | 98,812 |
| Investing cash flow (total) | (54,814) |
| Operating CF + investing CF — SML arithmetic from displayed statement lines | 56,894 |
| Dividends paid | (40,768) |
| Financing cash flow (total) | (40,617) |
| Cash and deposits at September 30, 2026 | 342,411 |
DISCO’s operating cash flow almost equals its operating income — ¥111,708 million against ¥116,639 million. That closeness is a working-capital and non-cash story, not a capex story: capital expenditure never passes through operating cash flow at all — equipment purchases sit in investing cash flow, which is where the ¥12,896 million appears in the table above. The company’s own explanation names the drivers: pre-tax income of ¥113,753 million and the increase in contract liabilities (the cash-flow statement records +¥29,872 million — cash collected, for part of the range at shipment, ahead of acceptance), with depreciation of ¥7,809 million added back because it is a non-cash charge. Against those inflows, the half absorbed cash into inventories (−¥19,496 million, building the shipment pipeline), a lower bonus provision (−¥11,644 million) and ¥23,127 million of tax payments.
The capital-light point belongs one step later, in free cash flow: because equipment purchases are only ¥12,896 million — 5.0% of sales (SML calculation) — most of the operating cash flow survives into SML’s free cash flow. This half’s low cash-capex burden should be assessed alongside the company’s multi-year building programme. Its full-year capital-expenditure plan is roughly ¥33.0 billion, against depreciation of roughly ¥16.0 billion. The building programme includes a Haneda R&D Center building of roughly ¥14 billion and a Hiroshima Works plant of roughly ¥33 billion, with payments spread across fiscal 2025–2027; those project totals are not all expenditure for fiscal 2026.
The company’s presentation reports approximately ¥56.9 billion of free cash flow, about ¥41.9 billion below SML’s measure. This measure combines operating cash flow plus investing cash flow, and this half’s investing cash flow contains a ¥41,844 million increase in time deposits — cash moved from one pocket to another, not spent on the business. Strip that single line out and the two definitions agree to within ¥0.1 billion. Adding the displayed statement lines gives ¥111,708 million minus ¥54,814 million, or ¥56,894 million. That is SML arithmetic using amounts rounded down to millions, not a claim that the company published that exact figure. Readers of the Advantest analysis have seen this exact bridge before, with purchases of debt instruments in the time deposits’ place. The habit to build is the same one SML’s free cash flow explainer teaches: whenever a company’s free cash flow differs from operating cash flow minus capex, open the investing section and find the line that explains the difference before using either number.
One more cash item, for completeness: the ¥40.8 billion of dividends paid in the half is the prior fiscal year’s year-end dividend leaving the company (see below). The interim dividend resolved on this half’s results is paid from December 2026 — a financing outflow of the next half.
Capital Returns: A Dividend Formula at Work
DISCO’s shareholder-return policy is one of the most mechanical in the Japanese market, and it is disclosed in full in the results presentation:
- Performance-linked core: target payout ratio of 25% of consolidated net income for the half-year period — dividends are set twice a year, off each half’s actual profit.
- A floor: a reliable dividend of ¥10 per share per half-year (¥20 per year) is paid regardless of the income level, reviewable only if losses continue for three fiscal years.
- A surplus rule: if year-end cash and deposits, after dividends and taxes, exceed the company’s projected funding requirements, one-third of the surplus is added to dividends — but only when the company is not in a loss. That condition is part of the rule as the company states it (“Unless there is a loss, … one-third of that surplus will be added to dividends”).
Applied to this half: net income was ¥80,366 million, and the interim dividend was set at ¥186 per share (prior-year interim: ¥129), with payment scheduled to start December 1, 2026. Against basic EPS of ¥740.84, ¥186 is almost exactly the 25% formula at work (SML arithmetic). The year-end dividend is not yet determined — under the formula it will be set off the second half’s profit, which is precisely the point: DISCO’s dividend is a direct, twice-yearly transmission of earnings, in both directions. For fiscal 2025 the same formula produced ¥129 interim plus ¥376 year-end, ¥505 for the year.
Two separate points about buybacks, kept apart because they are different kinds of fact. First, what this half’s materials show: they disclose no share buyback. Financing cash flow — a ¥40,617 million outflow in total — consisted mainly of the ¥40,768 million of dividends paid, alongside ¥225 million of proceeds from share issuance and ¥74 million of dividends paid to non-controlling interests. Separately, issued shares rose by 45,400 in the half: 42,400 from share-option exercises and 3,000 from restricted-stock compensation. There is no buyback line in financing cash flow, and treasury shares were unchanged at 16,004 shares. That is the observable record, and it is as far as these materials go: no buyback is disclosed in them. Second, the policy: DISCO’s shareholder-return framework contemplates share buybacks as one of the return methods the company may consider. That is a standing policy statement, not an authorization or a program. In this half’s materials, shareholder returns took the form of the dividend formula. An investor who wants the earnings themselves, in cash, twice a year, is looking at the mechanism working as designed.
Risks and Disconfirming Evidence
- The cycle is in the company’s own series. Shipments dropped 13% in a single quarter within the last six quarters (¥111.1 billion to ¥96.3 billion), and the third-quarter forecast already guides tool shipments down 5% sequentially. A record quarter is a data point, not a trend; the disconfirming evidence to watch is two consecutive shipment declines.
- Acceptance risk is the mirror of the shipments story. Sales depend on customers completing inspection and acceptance. Contract liabilities of ¥79.6 billion include cash collected at shipment for equipment not yet accepted — if acceptances slip, reported sales soften even while that cash stays.
- Geographic concentration. 78% of the quarter’s sales were in Asia and 31% in China (including local factories of foreign manufacturers). Export controls or a China capex pause would land directly on the largest region.
- Currency. Ordinary income already absorbed ¥3.1 billion of foreign-exchange losses this half, and the company quantifies its currency sensitivity in the presentation (annualized, per its own presentation): yen strength is a direct earnings headwind for a business that books 78% of sales in Asia and most of the rest overseas.
- Single-niche concentration. DISCO is one segment, one process family. If back-end capacity spending pauses — after an AI build-out digestion phase, for example — there is no second business to cushion it; the consumables layer may cushion the fall because it depends on use of the installed base, but it remains exposed to utilization declines.
- Margin normalization. The company evaluates a four-year consolidated ordinary-income margin against a minimum of 20%. Compare that with this half’s 44.5% ordinary-income margin, while recognizing that a minimum standard is not a forecast of normalized margins.
Weekly Market Chart
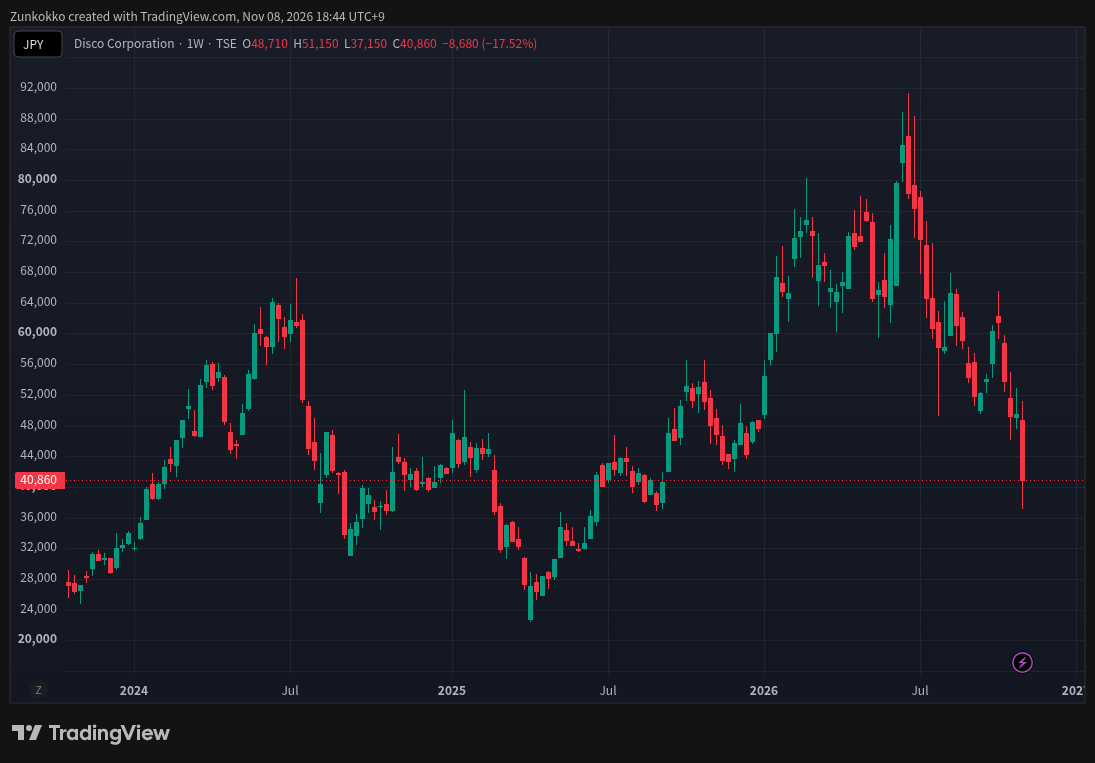
Source: TradingView, TSE:6146. Weekly candlesticks (1W), JPY; dividend adjustment enabled. Captured November 8, 2026 at 18:44 JST. Historical chart, not a live quote. View the original TradingView snapshot.
This chart provides historical market context. TradingView adjusts historical stock prices for splits, and dividend adjustment is enabled here. Adjusted historical values are not necessarily the prices originally traded on those dates. The chart is not a valuation estimate or a trading signal.
A Valuation Framework (Without a Live Price)
The weekly chart above is a dated historical snapshot, not a live quote. The framework below explains how to evaluate a separately verified current price.
- Earnings power, on the company’s own per-share figures: basic EPS was ¥740.84 for the first half, and the company’s nine-month forecast EPS is ¥1,123.43. A price-to-earnings ratio built on half-year or nine-month figures is a ratio against a cycle position: at a demand peak it flatters, at a trough it frightens. DISCO’s own four-year quality bars exist precisely because single-period multiples mislead here.
- Free-cash-flow yield, with the definition fixed first: SML-definition free cash flow was ¥98.8 billion for the half. Which half you annualize — a record half or a trough half — matters more than the arithmetic; and the company’s presentation figure (approximately ¥56.9 billion, under its own definition) should never be mixed into a comparison built on the SML definition. SML’s free cash flow guide walks through both traps.
- The balance sheet is part of the valuation: ¥342.4 billion of cash and deposits and essentially no debt mean a meaningful slice of any market value is cash, not operations. An enterprise-value comparison starts with equity market capitalization, adds debt and relevant non-controlling interests, and subtracts the cash or investments included in the chosen definition before comparing with operating earnings. Keep that definition consistent: cash and deposits include ¥141,783 million of deposits with terms longer than three months, while cash and cash equivalents were ¥200,627 million. Also consider the ¥31,814 million of income taxes payable when assessing how much cash is available.
- Return on capital: DISCO reports under Japanese GAAP and SML does not print an estimated ROIC for it. The company’s own RORA index (return on risk assets, four-year bar of 20% or more) is the closest company-defined return gauge; SML’s ROIC guide explains what such gauges are trying to measure and where definitions diverge.
Reader Checklist: What to Check Each Quarter
- Shipments, total and by layer — the leading line. Equipment for the cycle, tools for utilization. Compare with the company’s own single-quarter guidance from the prior presentation.
- The shipments-to-sales gap — a flow difference, not a balance: use it alongside contract liabilities and the company’s acceptance commentary, rather than as a direct measure of unaccepted equipment.
- Gross margin — 71.5% this half; mix and pricing show up here before anywhere else.
- Operating income, not ordinary income — FX moves sit between the two lines; anchor on the operating line.
- Free cash flow under both definitions — and the time-deposit line inside investing cash flow that bridges them.
- The dividend against the formula — 25% of half-year net income, with the ¥10 floor; and whether any buyback ever appears alongside it.
- Application mix — watch the optical-semiconductor share of dicer shipments and the company’s commentary on CPO-related demand, keeping the broader category separate from CPO itself.
Frequently Asked Questions
What does DISCO make?
Precision processing equipment and tools for the back end of semiconductor manufacturing: grinders that thin wafers, dicing saws (blade and laser) that cut wafers into individual dies, and the consumable blades, grinding wheels and polishing wheels those machines wear out. In its own terms: Kiru (cutting), Kezuru (grinding), Migaku (polishing).
What are “shipments,” and how are they different from sales?
Shipments (出荷額) are the value of products DISCO shipped in the period — ¥148.6 billion in July–September 2026, a record high. Equipment sales are recognized on customer inspection and acceptance, which can occur after shipment. Shipments can therefore lead reported equipment sales. The gap between the two in any period is a difference between flows, not a balance-sheet amount: it is not equal to contract liabilities (¥79.6 billion at September 30, 2026), although that balance — which includes amounts associated with payment upon shipment — is where part of the cash side of the not-yet-accepted pipeline appears. Never read a shipments figure as revenue.
Which results does this article cover?
The first half of the fiscal year ending March 31, 2027 (April 1 to September 30, 2026), released October 22, 2026, under Japanese GAAP on a consolidated basis, with the standalone second quarter shown separately from the company’s presentation. The figures in the labeled outlook block are the company’s nine-month and third-quarter forecasts, not results. DISCO publishes no full-year forecast.
Why are there two free-cash-flow numbers?
SML defines free cash flow as operating cash flow minus purchases of property, plant and equipment: ¥111,708m − ¥12,896m = ¥98,812m for the half. DISCO’s presentation reports approximately ¥56.9 billion for the half. Operating cash flow plus investing cash flow equals ¥56,894 million using the displayed statement lines; that is SML arithmetic. Investing cash flow includes a ¥41,844 million increase in time deposits, cash moved rather than spent. Both are printed in the article, with the bridge, and they should never be mixed in one comparison.
How does DISCO return cash to shareholders?
Through dividends, by formula: a target payout of 25% of consolidated net income for each half-year, a floor of ¥10 per share per half-year, and a surplus-cash top-up — one-third of surplus funds added to dividends, provided the company is not in a loss. The interim dividend for fiscal 2026 is ¥186 per share, payable from December 1, 2026; the year-end dividend is set after the second half. The half-year materials disclose no share buyback; the company’s return framework mentions buybacks as a method it may consider, which is a policy statement, not a disclosed program.
How can U.S. investors access DISCO shares?
DISCO lists only in Tokyo (TSE Prime, 6146) and has no sponsored ADR program. On the US over-the-counter market there is an unsponsored ADR under the ticker DSCSY. BNY is one of the depositary banks behind that line — unsponsored receipts are issued by depositary banks without the company’s involvement, and more than one depositary can stand behind the same ticker. BNY’s official ADR directory entry for the line confirms that 10 ADRs represent 1 ordinary share (each ADR represents 0.10 ordinary shares; CUSIP 25461D100). Read the depositary’s terms before using DSCSY; this article makes no claim about its liquidity.
Is DISCO a monopoly?
The company describes its position qualitatively — its investor materials say its initiatives have produced high market share and high profitability — and the margin structure (71.5% gross margin, 45.4% operating margin this half) is consistent with a strongly defended niche. DISCO does not publish a current market-share figure in its earnings materials, so this article prints no percentage. Judge the niche by the economics it produces and by whether the consumables layer keeps growing with the installed base.
Primary Sources and Methodology
- DISCO Corporation, 88th-period Half-Year Report, filed October 29, 2026 — share issuance sources (printed p.7), cash-equivalent reconciliation (p.17), single-segment disclosure and dividends (p.18): https://www.disco.co.jp/jp/ir/library/doc/fs/fs88h.pdf
- DISCO Corporation, “Business” — precision equipment and consumables, product variety and 1937 origins: https://www.disco.co.jp/eg/ir/mginfo/bg_business.html
- DISCO Corporation, Summary of Consolidated Financial Results for the Second Quarter of Fiscal Year 2026 (earnings release, Japanese GAAP, consolidated), released October 22, 2026 — English edition (income statement, balance sheet summary, cash-flow statement, dividend and forecast sections) and Japanese edition (headline figures, qualitative section including the half-year shipment value, dividend payment start date), cross-checked against each other: https://www.disco.co.jp/eg/ir/library/doc/fr/fr20261022.pdf and https://www.disco.co.jp/jp/ir/library/doc/fr/fr20261022.pdf
- DISCO Corporation, FY2026 Q2 results presentation, October 22, 2026 — quarterly results and forecast table, quarterly shipment values and product composition, application and regional splits, balance-sheet and cash-flow summaries including the company’s free-cash-flow definition, and the dividend policy: https://www.disco.co.jp/eg/ir/library/doc/film/20261022.pdf
- DISCO Corporation, investor-relations pages — dividend policy wording and the business-quality indexes (four-year consolidated ordinary income margin and RORA of 20% or more): https://www.disco.co.jp/eg/ir/mginfo/msg_share.html (“To Investors Considering Purchasing DISCO Shares”).
- DISCO Corporation, DBG (Dicing Before Grinding) process page — the usual sequence is grinding first and full dicing after; DBG reverses it: https://disco.co.jp/eg/solution/library/dbg/dbg_process.html (fetched November 1, 2026).
- Advantest Corporation, “Our Technology In-Depth: Semiconductor Test” — test systems are used at the end of the wafer production process (wafer test) and in the final inspection process after packaging; the basis for this article’s placement of test on both sides of DISCO’s steps: https://www.advantest.com/en/about/business/ (fetched November 1, 2026).
- BNY (one of several depositary banks behind the unsponsored DSCSY line), official ADR directory entry for the line — CUSIP 25461D100; unsponsored ADR; ratio 1 ordinary share = 10 ADRs, confirmed from BNY’s official directory page on November 1, 2026 and rechecked November 3, 2026: https://www.adrbny.com/directory/dr-details/_jcr_content/root/drDetailsComponent.overview.overview.25461D100.html. DISCO itself publishes no ADR program; the ADR’s existence and terms are stated from the depositary side only.
Figures are in Japanese yen. Amounts marked as SML calculations — the SML-definition free cash flow, the shipments-to-sales gap, capex as a share of sales, the dividend-versus-formula check and percentage changes not printed by the company — are Stock Metric Lab arithmetic from the cited reported figures. The broader source review was completed on November 3, 2026, including the October 29 half-year report. On November 8, the earnings release, results presentation, latest IR-news list and BNY ADR terms were rechecked; the cash-flow table separates the company’s rounded presentation figure from SML arithmetic. English materials were cross-checked against the Japanese release; where a figure appears in only one source, the text says so. No current valuation is calculated from market prices. The weekly chart is a dated historical snapshot. No market-share percentage is printed, because the company does not publish a current one. Market prices, ADR terms and tax rules can change; readers should verify them as of their decision date.
This article is for educational and informational purposes only. It is not investment, financial, tax, legal, or accounting advice, and it is not a recommendation to buy, sell, or hold any security. Verify current filings, ADR terms, tax rules, foreign-exchange rates, and market information before making an investment decision.