Before an AI chip can be tested, it has to be built — layer by layer, on a silicon wafer, inside a cleanroom. Tokyo Electron, listed on the Prime Market of the Tokyo Stock Exchange under code 8035, builds many of the machines that do that building: the coaters, etchers, deposition and cleaning systems that turn blank wafers into processors and memory.
That position produced a strong first half. For April–September 2026, net sales were ¥1,667.455 billion, up 41.3%, and operating income was ¥506.776 billion, up 67.2%. Operating margin reached 30.4%. Field Solutions contributed approximately ¥379.0 billion, or 22.7% of sales by SML calculation.
This analysis connects the equipment cycle to the installed-base business, cash conversion and shareholder returns. It is education, not a recommendation.
Results through September 30, 2026; company outlook announced October 30, 2026. FY2027 means the year ending March 31, 2027. H1 covers April–September; Q2 alone covers July–September. Forecasts are separate from actual results. Yen amounts in tables are billions unless stated otherwise.
The Thesis in One Minute
- Equipment exposure: Tokyo Electron sells machinery used to manufacture chips. Its business sits upstream of the testing systems discussed in the Advantest analysis.
- Installed-base revenue: Parts, services, used equipment and modifications provide another source of sales, although customers’ utilization and investment budgets still matter. These are sales categories, not separately reported profit segments.
- Stronger results, a new forecast: H1 operating margin was 30.4%. On October 30 the company introduced its previously undetermined full-year forecast: ¥3.7 trillion of sales and ¥1,169 billion of operating income. Neither figure is an actual result.
- Cash and distributions: H1 operating cash flow was ¥469.934 billion. Cash dividends of ¥166.041 billion and treasury-share purchases of ¥150.025 billion are historical cash outflows. A new authorization for up to ¥150 billion is a separate future program.
- A cyclical business: China contributed approximately 33.8% of H1 sales. Customer investment, technology transitions and export restrictions can change the earnings outlook. The semiconductor equipment framework explains which indicators to track.
What Tokyo Electron Actually Makes
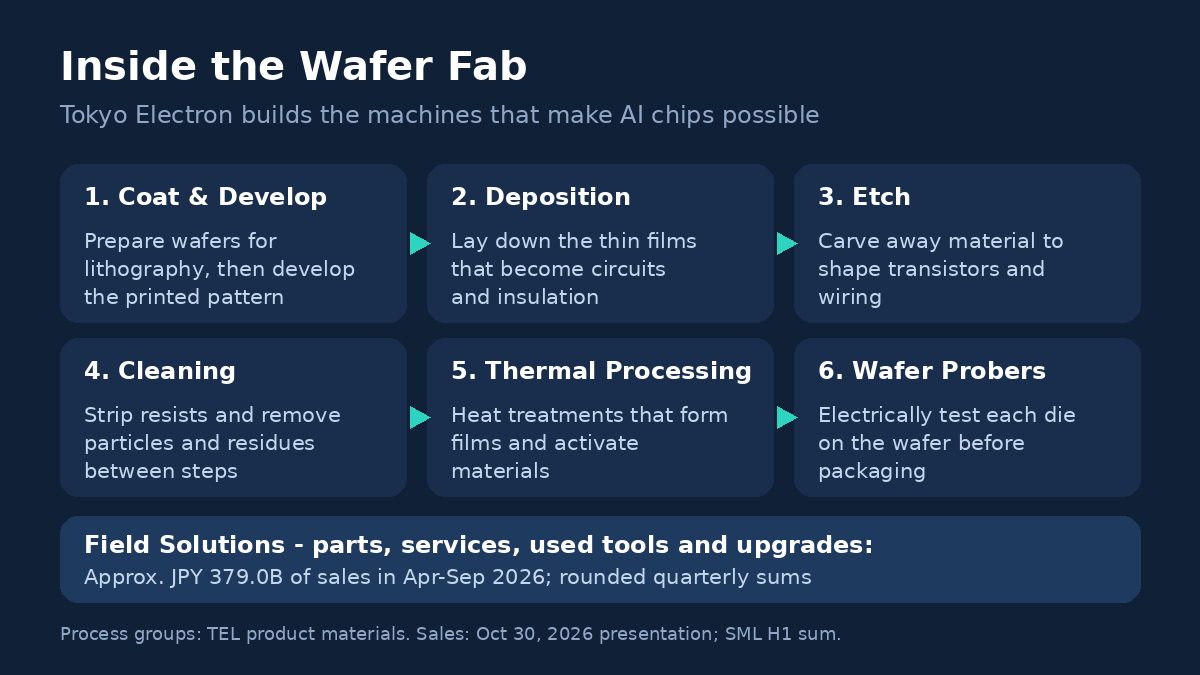
A modern chip is built in loops. A wafer is coated with a light-sensitive film and patterned (lithography), material is deposited to form a layer, the unwanted parts are etched away, residues are cleaned off — and then the loop repeats, dozens of times, until the wafer carries finished circuits. Tokyo Electron sells machines for most steps of that loop except the lithography exposure itself, which is ASML’s territory:
- Coater/developers (the company’s CLEAN TRACK / LITHIUS Pro series) coat the wafer with photoresist before exposure and develop the pattern afterwards. They work in line with the lithography scanner for the layers that require lithographic patterning.
- Deposition systems lay down the thin films — conductors, insulators, barrier layers — that become the chip’s structure.
- Etch systems remove material selectively to carve transistors and wiring. Etch intensity rises as devices stack more layers, which is why etch is one of the company’s highlighted growth areas.
- Cleaning systems strip resists and remove particles and residues between steps; in a process with hundreds of steps, yield lost to contamination is money lost.
- Thermal processing systems apply the heat treatments that form films and activate materials.
- Wafer probers (the Prexa series) electrically test each die on the finished wafer before it is cut and packaged — the point where this company’s world meets the test world of the Advantest analysis.
- Advanced-packaging tools, including bonding equipment, address the fast-growing step of combining finished dies into a single package.
One structural fact matters for reading the numbers: Tokyo Electron reports a single segment, “Semiconductor Production Equipment.” There is no segment profit table to mine. The split between new equipment and Field Solutions comes from the sales-composition disclosure in the results presentation — and because it is a sales split only, no Field Solutions profit margin is published. Anyone quoting one is estimating.
For the back-end grinding and dicing steps, see the DISCO analysis. For the wider map of the chip supply chain, see SML’s AI Infrastructure Hub and the guide to how to analyze semiconductor stocks.
Two Revenue Layers: New Machines and the Installed Base
H1 FY2027 sales breakouts, April–September 2026:
| Component | Sales | Share of total sales |
|---|---|---|
| SPE new equipment | ¥1,265.7B | 75.9% |
| Field Solutions | approximately ¥379.0B | 22.7% |
| — parts and services | approximately ¥280.0B | — |
| — used equipment and modifications | approximately ¥98.9B | — |
| Net sales | ¥1,667.455B | 100% |
New-equipment sales are shown in the October 30 presentation’s H1 table. Field Solutions and its subcategories are SML sums of the presentation’s rounded Q1 and Q2 amounts. Shares use total sales and are SML calculations. These are “of which” breakouts, not an exhaustive decomposition: ¥1,265.7B + ¥379.0B leaves approximately ¥22.8B relative to total sales. The remainder is not assigned to an invented category; rounding also explains the small gap between the two Field Solutions subcategories and its total.
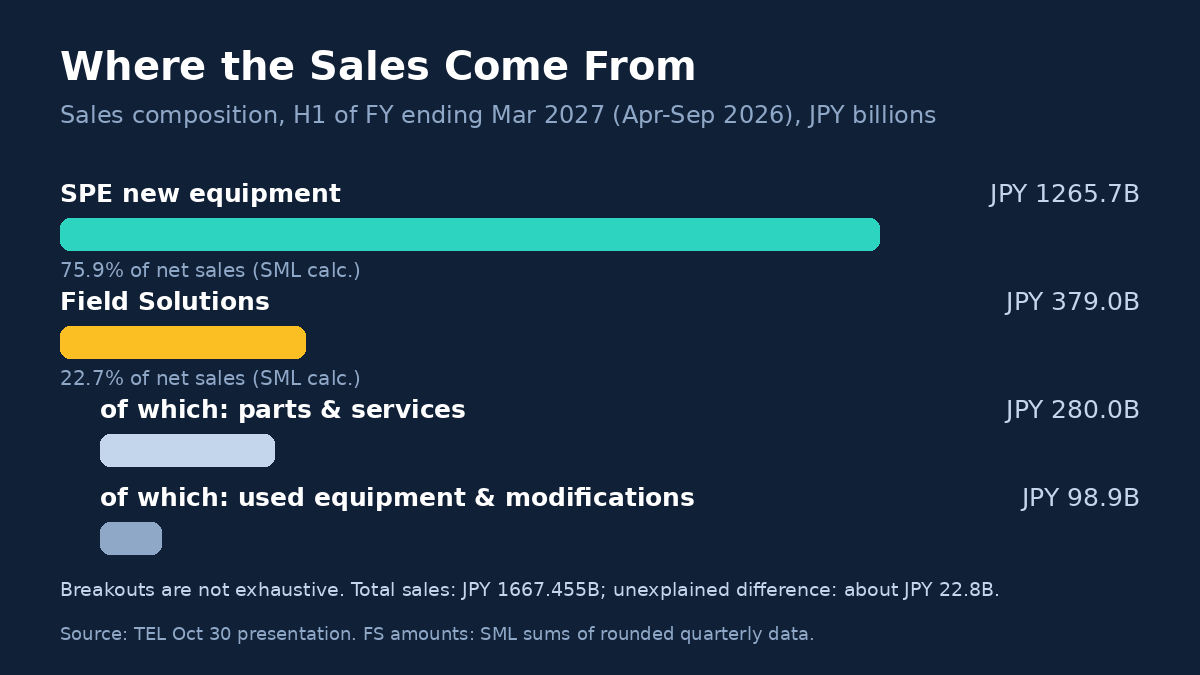
New-equipment demand follows customers’ fab-investment decisions. Parts and services draw on an installed base, while used machines and modifications also depend on spending appetite. Recurring activity is not guaranteed revenue, and no separate Field Solutions profit margin is reported.
Regional sales, H1 FY2027 — SML sums of rounded quarterly disclosures:
| Region | Approximate sales | Approximate share |
|---|---|---|
| Japan | ¥136.8B | 8.2% |
| North America | ¥135.6B | 8.1% |
| Europe | ¥65.9B | 4.0% |
| South Korea | ¥343.1B | 20.6% |
| Taiwan | ¥366.5B | 22.0% |
| Southeast Asia / Others | ¥56.1B | 3.4% |
| China | ¥562.8B | 33.8% |
Shares divide the rounded regional sums by ¥1,667.455B. Rounded amounts and percentages do not sum exactly to the reported total. China was 36.4% of Q2 alone; that is not the H1 percentage.
Latest Results: First Half Actuals
Japanese GAAP, consolidated; six months ended September 30, released October 30, 2026.
| Metric | H1 FY2027 | H1 FY2026 | Change |
|---|---|---|---|
| Net sales | ¥1,667.455B | ¥1,179.668B | +41.3% |
| Gross profit | ¥790.102B | ¥538.861B | +46.6% |
| Gross margin | 47.4% | 45.7% | +1.7 pts |
| Operating income | ¥506.776B | ¥303.153B | +67.2% |
| Operating margin | 30.4% | 25.7% | +4.7 pts |
| Ordinary income | ¥514.401B | ¥306.896B | +67.6% |
| Net income attributable to owners | ¥376.929B | ¥241.626B | +56.0% |
| Basic EPS, split adjusted | ¥166.13 | ¥105.46 | — |
| Diluted EPS, split adjusted | ¥165.59 | ¥105.12 | — |
Margins are calculated from the reported amounts and rounded to one decimal. SG&A included ¥157.325B of R&D. A ¥6.220B disaster loss related mainly to the Kumamoto earthquake was recorded below operating income; it is not an operating-expense adjustment invented by SML.
At September 30, inventories were ¥747.491B and customer advances were ¥354.862B; compare both with future shipments rather than treating either as proof of future revenue. The equity ratio was 68.2%.
Q2 alone, July–September, delivered ¥935.0B of sales and ¥295.3B of operating income, with a 31.6% operating margin (presentation figures, truncated to one decimal). Do not confuse this quarter with cumulative H1.
Full-year company forecast — not results. On October 30, 2026, TEL first disclosed the previously undetermined outlook for the year ending March 31, 2027.
Metric FY2027 forecast Change vs FY2026 actual Net sales ¥3,700B (¥3.7 trillion) +51.4% Operating income ¥1,169B +87.1% Ordinary income ¥1,179B +87.0% Net income attributable to owners ¥865B +50.6% Basic EPS, split adjusted ¥381.69 — H1 sales exceeded the July forecast by 2.9%, and operating income by 10.6%; those are forecast comparisons, not year-over-year growth. Actual full-year results may differ materially from this outlook.
The Cycle, in the Company’s Own Numbers
The October 30 presentation puts the WFE market at approximately $160 billion in calendar 2026 and more than $210 billion in 2027. These are company market estimates, not TEL revenue or reported industry results. AI-related investment supports demand, but customer spending can change before equipment revenue is recognized.
The FY2027 company plan includes ¥335B of R&D and ¥190B of capital expenditure. Capital expenditure in the presentation and cash purchases of PP&E in the cash-flow statement are different measures; do not substitute one into the other’s calculation. The AI capex comparison gives the wider investment context.
Cash Flow: First Half Generation and Distributions
April–September 2026 cash-flow statement:
| Item | ¥ billion |
|---|---|
| Operating cash flow | 469.934 |
| Cash purchases of PP&E | (70.182) |
| Cash purchases of intangible assets | (7.476) |
| Investing cash flow | (79.218) |
| Cash dividends paid | (166.041) |
| Purchases of treasury stock | (150.025) |
| Financing cash flow | (318.124) |
| Cash and cash equivalents at September 30 | 578.601 |
Operating cash flow included a ¥82.862B increase in customer advances but absorbed ¥91.421B of receivables and contract-asset growth, ¥31.099B of inventory growth and ¥108.591B of income-tax payments. Cash conversion therefore reflects working-capital and payment timing, not just profitability.
Under the SML free-cash-flow definition, operating cash flow minus cash PP&E purchases gives ¥399.752B, or ¥399.8B rounded. TEL defines FCF as operating plus investing cash flow excluding time deposits and short-term investments. Applying that definition to the H1 statement, adding back the ¥0.340B time-deposit outflow, gives ¥391.056B, or ¥391.1B. This is an SML reconstruction using the company’s definition; summing the separately truncated quarterly presentation values is not an exact H1 calculation.
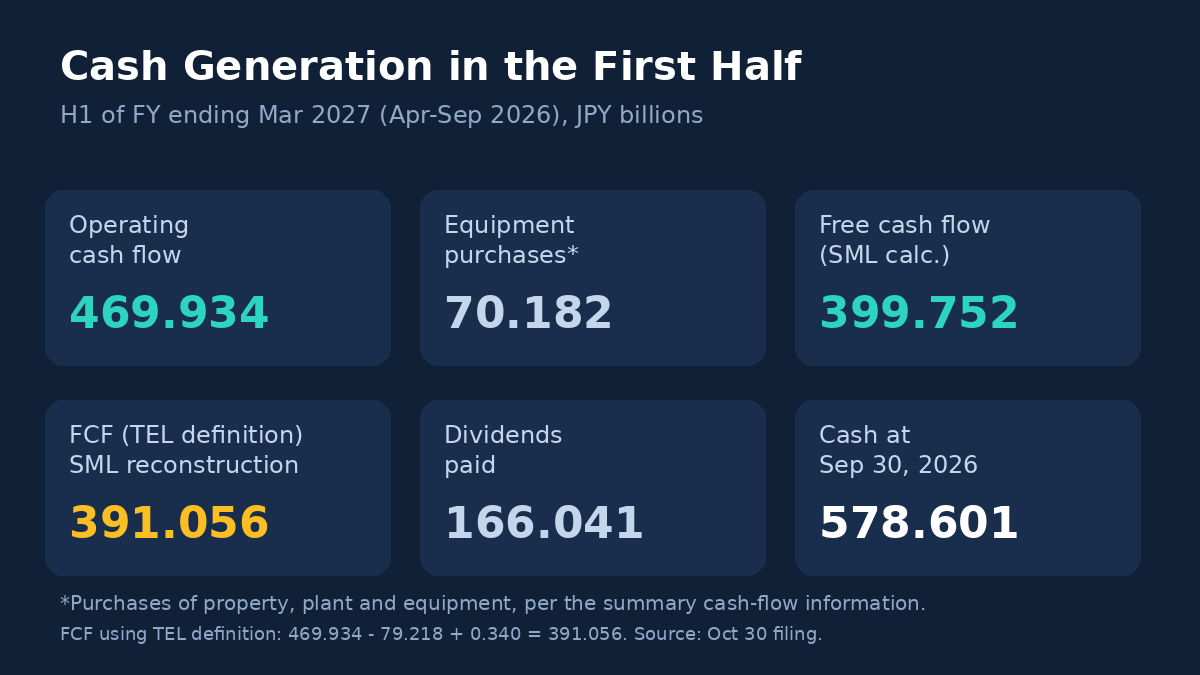
Cash plus deposits and short-term investments outside cash equivalents totaled ¥579.762B, a different scope from the ¥578.601B cash-equivalent figure. The ROIC guide discusses the complementary capital-efficiency lens; this article does not invent a company-reported ROIC.
Capital Returns: Dividends and a New Buyback Authorization
TEL targets a payout ratio around 50% of net income attributable to owners, with a post-split annual dividend floor of ¥10 and a policy review if it fails to generate net income for two consecutive years.
- Interim dividend: ¥415 on the pre-split share basis, with payment scheduled to begin November 27, 2026. Its comparable post-split amount is ¥83.
- Year-end dividend forecast: ¥108 post-split. The comparable full-year forecast is ¥191 (¥83 + ¥108), not ¥523. Only the year-end component remains a forecast at this stage.
- Historical H1 cash flows: dividends paid were ¥166.041B and treasury-share purchases ¥150.025B. The latter is the cash-flow line, including its full accounting scope, not evidence that the new program was completed.
- New October 30 authorization: up to ¥150B and 25 million shares, approximately 1.1% of shares excluding treasury shares, for November 1, 2026–March 31, 2027. Market conditions may result in partial or no execution. Do not add its maximum to completed purchases and call the sum cash already returned.
The five-for-one ordinary-share split took effect October 1, 2026. H1 EPS and forecast EPS above are already split adjusted; do not divide them by five again. Historical Q1 EPS of ¥361.36 was pre-split, approximately ¥72.27 after division, and is not directly comparable without that adjustment.
Listing and U.S. access — as officially announced
- Home listing: Prime Market of the Tokyo Stock Exchange, code 8035.
- U.S. ADR program (new): Tokyo Electron established a Sponsored Level I ADR program with JPMorgan Chase Bank, N.A. as depositary, per the company’s announcement of September 17, 2026. The ADRs trade on the U.S. over-the-counter (OTC) market under the ticker TELWY, with trading beginning September 17, 2026 (U.S. time). At establishment, the ratio was 2 ADRs = 1 ordinary share (CUSIP 889110201; custodian: Mizuho Bank). The program involved no capital raising and no issuance of new shares.
- What came before: Tokyo Electron ADRs previously traded in the U.S. as unsponsored ADRs (ticker TOELY) — programs set up by depositary banks without the company’s involvement. The company states the unsponsored ADRs are expected to transition into the new sponsored program.
- Current company reference: As checked on November 8, 2026, TEL’s Stock Information page lists TELWY with an ADR-to-ordinary-share ratio of 2:1. The depositary’s current terms, corporate-action treatment, fees and availability should still be checked before a transaction. This article does not independently verify depositary processing of the October split or imply that every reader can trade either line.
Risks and Disconfirming Evidence
- Cycle and forecast risk: the full-year forecast requires further sales and profit beyond H1. Customer spending cuts or shipment delays can undermine both revenue and margins.
- China exposure: approximately ¥562.8B, or 33.8%, of H1 sales came from China. Export restrictions and domestic substitution are risks; this article does not offer legal conclusions about individual products or customers.
- Customer concentration: large fab-investment programs matter disproportionately to equipment suppliers. No unverified named-customer percentages are included here.
- Technology transitions: process-of-record wins can be lost at a new node; development spending is necessary but does not guarantee future share.
- Working capital: rising inventory or receivables without corresponding shipments and collections would challenge the cash-conversion story. Customer advances are not a guarantee against cancellations or timing changes.
- Currency: TEL states that export sales are generally yen-denominated, but some sales and expenses are in foreign currencies. Large currency changes can affect performance; zero currency risk is not claimed.
- ADR mechanics: the current depositary ratio, fees and liquidity require verification. The historical establishment ratio above is not a current trading conversion instruction.
Weekly Market Chart
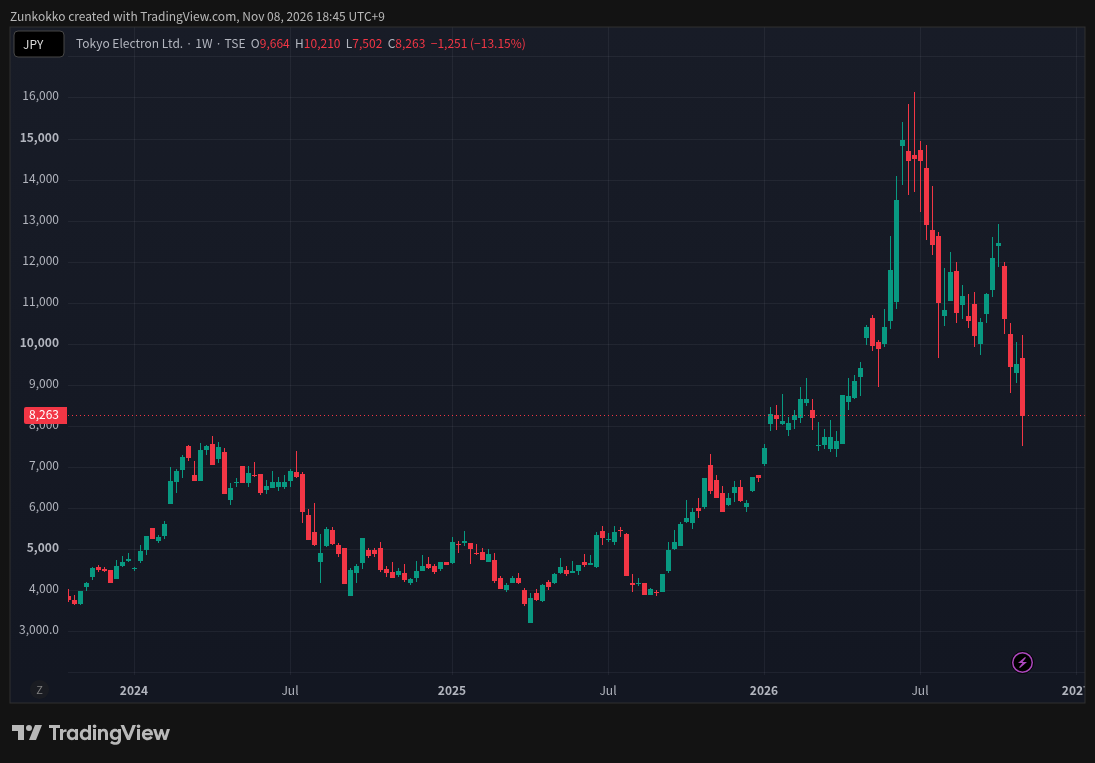
Source: TradingView, TSE:8035. Weekly candlesticks (1W), JPY; dividend adjustment enabled. Captured November 8, 2026 at 18:45 JST. Historical chart, not a live quote. View the original TradingView snapshot.
This chart provides historical market context. TradingView adjusts historical stock prices for splits, and dividend adjustment is enabled here. Adjusted historical values are not necessarily the prices originally traded on those dates. The chart is not a valuation estimate or a trading signal.
A Valuation Framework (Without a Live Price)
The earnings inputs are ¥166.13 H1 actual basic EPS and ¥381.69 full-year forecast EPS, both on the post-split basis. The previous full year’s comparable actual EPS was ¥250.91. Keep annual and half-year periods distinct; the H1 figure is not annual earnings.
A price divided by forecast EPS is a forward P/E, not a realized or through-cycle multiple. In a cyclical equipment business, test weaker sales and margins rather than multiplying peak earnings indefinitely. Keep the FCF definition consistent and allow for working-capital reversals, continued R&D and equipment investment.
Use a post-split price with post-split EPS. Future buyback execution can affect share counts, but an authorization does not establish how many shares will be retired. The weekly chart above is a dated historical snapshot, not a live quote. No market capitalization or target price is supplied here.
Reader Checklist: What to Check Each Quarter
- Sales and operating income against the October 30 full-year forecast.
- New-equipment demand and the separately disclosed Field Solutions business.
- China exposure and relevant company disclosures on export restrictions.
- Inventories, receivables, advances and their cash-flow effects.
- Operating margin versus the 30.4% H1 actual and company forecast assumptions.
- FCF using consistent definitions, including the treatment of intangible purchases.
- Actual execution of the new buyback and updates to the year-end dividend forecast.
- Revisions to WFE market expectations, keeping calendar years separate from TEL fiscal years.
Frequently Asked Questions
What does Tokyo Electron make?
Semiconductor production equipment used in deposition, etch, coating/development, cleaning, thermal processing and wafer probing. It reports one segment, not a separate Field Solutions profit segment.
What is Field Solutions?
Parts, services, used machines and modifications for the installed base. H1 sales were approximately ¥379.0B, or 22.7% of total sales by SML calculation. The source quarterly values are rounded.
Which results does this article cover?
April–September 2026, the first half of FY2027, released October 30. Full-year figures are the company’s separately labeled forecast, newly disclosed on that date.
Why are there two FCF numbers?
SML’s operating-cash-flow-minus-cash-PP&E measure gives ¥399.752B. Applying TEL’s stated definition to the H1 cash-flow statement gives ¥391.056B. They answer different questions; neither definition should silently replace the other.
Is the ¥150 billion buyback completed?
The new October 30 authorization is a cap for November 2026–March 2027, not a completion announcement. It is separate from the ¥150.025B of treasury-share purchases in the H1 cash-flow statement.
What is TELWY?
The sponsored Level I ADR ticker identified in TEL’s September 17 announcement. TEL’s Stock Information page lists 2 ADRs per ordinary share as checked on November 8, 2026. Confirm current depositary terms, corporate-action treatment, fees and availability before relying on that ratio for a transaction.
Did the five-for-one split create value?
The split alone did not change ownership percentages or company cash flows. It changed share counts and per-share units. H1 EPS is already restated, while the ¥415 interim dividend is quoted on the old share basis.
Primary Sources and Methodology
October 30, 2026 consolidated financial results: H1 statements, full-year forecast, dividends, stock split and new repurchase authorization.
October 30, 2026 results presentation: quarterly regional and Field Solutions disclosures; H1 new-equipment sales; WFE outlook; R&D, capex and dividends.
September 17, 2026 ADR establishment announcement: historical program establishment terms.
TEL Stock Information: company-listed ADR terms, checked November 8, 2026; depositary processing has not been independently verified.
TEL product catalogue: product categories and named platforms.
B means billion yen. Financial-statement amounts retain million-yen precision where useful; presentation amounts may be truncated. Regional and Field Solutions H1 sums, margins and FCF reconciliations are explicitly labeled SML calculations. No live valuation, exact application mix or newly confirmed medium-term target is inferred. The ADR ratio is attributed to the company’s dated website check, not presented as an independently verified depositary instruction.
For educational and informational purposes only. Not a recommendation to buy, sell or hold any security. Verify current filings and market information before making an investment decision.