
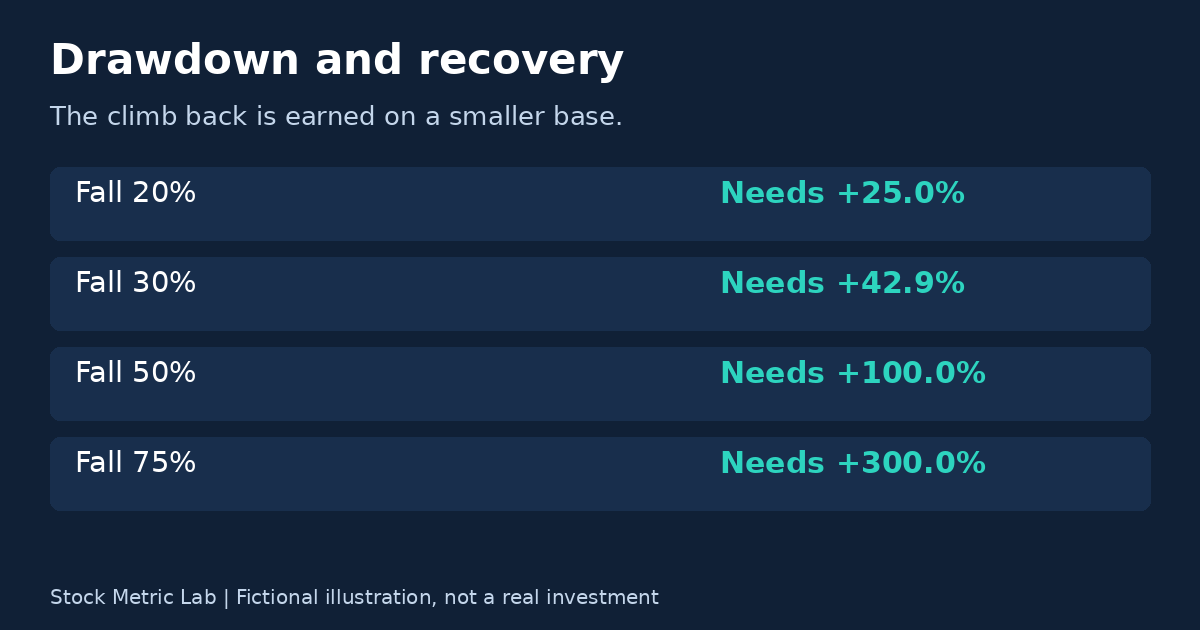
Falls and recoveries are not the same size. An investment that drops 20% does not come back with a 20% rise — it needs 25%. One that drops 50% needs 100%. This guide explains the arithmetic behind that asymmetry, how drawdowns are measured, and why the size of a fall matters more than it first appears.
Every example in this article is fictional and uses round numbers chosen for teaching. No real stock or index is measured, and nothing here is a prediction: a recovery is never guaranteed, and some falls are never recovered at all. All figures in this guide are also on a price basis: they follow the price alone and exclude dividends received along the way, fees, taxes, inflation and external cash flows. If dividends are paid, a total-return measurement may show a different path — the measurement-basis section below returns to this.
What a drawdown is
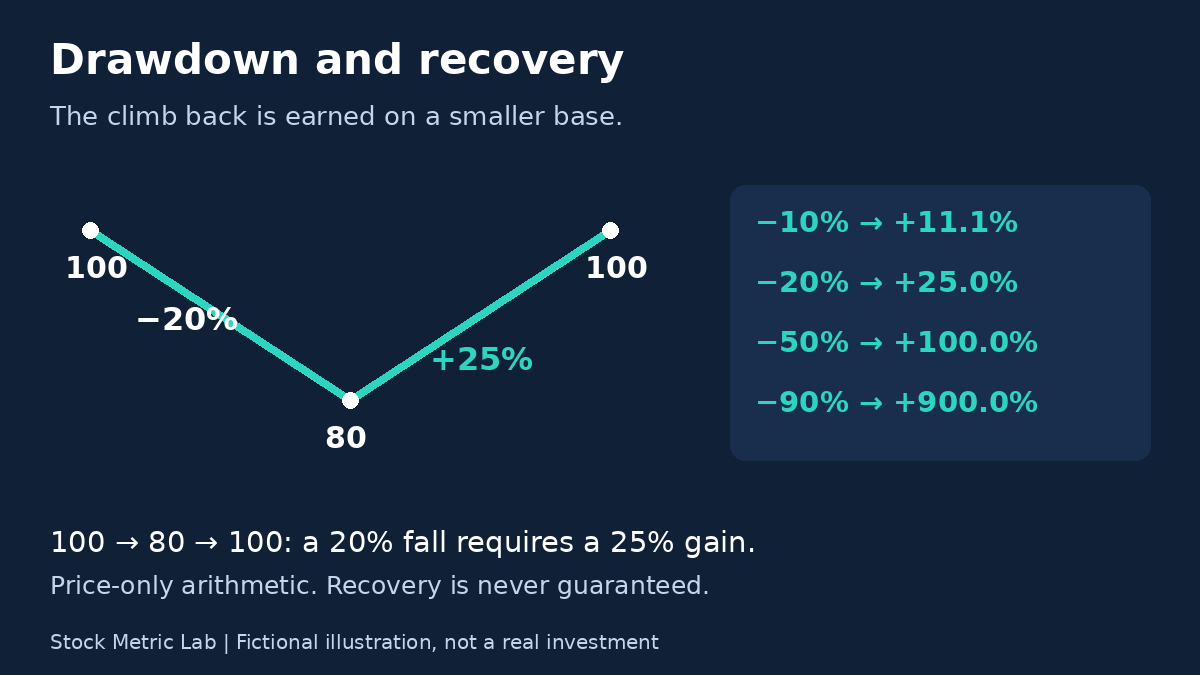
A drawdown is a fall from a previous peak. If an investment reaches 100 and later trades at 80, it is in a 20% drawdown: it sits 20% below its high. The peak is the reference point — not your purchase price. If you bought at 60 and the price reached 100 before falling to 80, the drawdown from the peak is still 20%, even though you are still ahead of what you paid. Drawdown measures the distance from the top, whoever bought where.
The maximum drawdown over a period is the largest peak-to-trough fall anywhere in that period, measured continuously: at every point along the path, compare the current value with the highest value reached up to and including that point, and the maximum percentage drawdown is the deepest of those percentage falls. At a new high, the drawdown is zero. It is not simply the drop from the period's single highest point to its single lowest point — if the lowest point arrives before the highest, those two points are never paired, and an earlier peak-to-trough fall, smaller in points but larger as a percentage of its own peak, can be the maximum. When financial writing says an asset is "down 30% from its high," the simpler single-peak measurement is usually the one being used. (The running-peak formulation follows the standard definition of the measure in the risk literature: maximum drawdown as the maximum cumulative loss from a peak to a following bottom — Magdon-Ismail et al., "An Analysis of the Maximum Drawdown Risk Measure", RISK, 2004.) Our guide to reading a stock chart shows where peaks and troughs sit on a price chart.
The recovery table
The fall is measured from the peak. The recovery must be earned from the smaller, fallen value. That single fact produces the whole table:
| Fall from the peak | Value of 100 after the fall | Gain needed to get back to 100 |
|---|---|---|
| −10% | 90 | +11.1% |
| −20% | 80 | +25.0% |
| −30% | 70 | +42.9% |
| −40% | 60 | +66.7% |
| −50% | 50 | +100.0% |
| −60% | 40 | +150.0% |
| −75% | 25 | +300.0% |
| −90% | 10 | +900.0% |
Read the last two rows slowly. At −75%, the remaining quarter must quadruple. At −90%, the remaining tenth must increase tenfold. The formula is the same at every row: the gain required is the fall divided by what is left — for a fall of d, the recovery gain is d ÷ (1 − d). At small falls the gap between the fall and the required gain is easy to miss (10% versus 11.1%). At large falls it dominates everything.
Why the math feels unfair
Percentages are not symmetric, because a percentage is always taken of something, and the something changes. A 20% fall is 20% of 100 — twenty points. A 20% rise from 80 is 20% of 80 — only sixteen points, landing at 96. The fall was computed on the larger starting value; the recovery is computed on the smaller one.
The same trap works in the other order. Take 100, add 50%, then subtract 50%: 100 → 150 → 75. Two "equal and opposite" moves leave you 25% down, because the 50% fall was taken from 150, not from 100. Whenever someone describes a fall and a rise with the same percentage, they have not described a round trip.
Drawdown, volatility and loss are three different things
Volatility describes how much prices typically move, in either direction — measures such as the standard deviation of returns, or range-based indicators, summarise the size of ordinary fluctuations. Volatility is a property of the path; drawdown is a property of one episode on that path. An investment can be volatile and sitting at a new peak, or quiet for years and deep in drawdown. They answer different questions, and one does not substitute for the other.
A drawdown is also not yet a loss in the realised sense. While you still hold the investment, the decline is an unrealised (on-paper) fall in value. What a sale realises is measured against your purchase price, not against the peak: sell at a level below the peak but above what you paid, and the sale is a realised gain despite the drawdown; sell below what you paid, and the loss becomes realised. But hold the sentence carefully in both directions: "unrealised" does not mean "not real," and it does not mean "temporary." If the underlying business fails, a drawdown can become permanent — a price can fall and never return, and in the extreme can go to zero, at which point no recovery percentage exists at all. The table above describes what a recovery would require. It never promises that one arrives.
How you size positions and spread holdings before a fall arrives is a separate topic, covered in our guide to investment risk and diversification.
The measurement basis matters: price or total return?
A price-only drawdown follows the price alone. For an investment that pays dividends, price is only part of the return. A total-return measurement counts dividends as well (typically assuming they are reinvested), so a holding whose price is still below its old peak may already have recovered on a total-return basis — the dividends it paid along the way are part of the climb back.
Neither basis is "the true one"; they measure different things, and mixing them manufactures confusion. A claim that something "has recovered" or "is still down" is incomplete until it says which basis it uses. Check the label before comparing two drawdown figures from different sources.
Time is part of the cost
Recovery arithmetic has a second, quieter term: time. While capital is climbing back to its old peak, it is producing no net progress — it is re-earning ground it already held. To see the size of that effect, take a purely hypothetical illustration: suppose, only for the sake of the arithmetic, that a fallen investment then grew at a perfectly steady rate. Real markets never do this, and the rates below are not forecasts or expected returns for anything.
| Drawdown | Years to break even at a hypothetical steady 5% a year | At a hypothetical steady 10% a year |
|---|---|---|
| −20% | about 4.6 years | about 2.3 years |
| −30% | about 7.3 years | about 3.7 years |
| −50% | about 14.2 years | about 7.3 years |
The point is not the particular numbers — change the assumed rate and they all move. The point is the shape: doubling a drawdown much more than doubles the time spent merely getting back to the starting line, and during all of that time the capital was not compounding from the peak. Our guide to compounding, fees and inflation covers the positive side of the same arithmetic — growth building on growth — of which this is the mirror image. Preparing for falls before they happen, in the context of your own finances, starts with the money plan that comes before investing at all.
A short checklist for reading drawdown claims
- Find the reference peak. A drawdown is measured from a high, not from your purchase price. Ask "down from what, and since when?"
- Do the recovery math before reacting. The gain required is the fall divided by what remains: a 30% fall needs 42.9%, not 30%.
- Ask which basis is being used. Price only, or total return including dividends? Two sources quoting different numbers may both be right.
- Separate price damage from business damage. A falling price asks a question; it does not answer it. Whether the business underneath has changed is the work of analysing the stock itself.
- Count the time. Getting back to the peak is a return to the starting line, not progress — and a recovery is a possibility to weigh, never a schedule to rely on.
Frequently asked questions
If a stock falls 50% and then rises 50%, am I back where I started? No. From 100, a 50% fall leaves 50; a 50% rise from 50 adds 25, landing at 75. The fall was taken from 100 and the rise from 50 — the same percentage on different bases is a different amount of money.
What is maximum drawdown? The largest peak-to-trough decline over a stated period: at each point, the fall from the highest value reached up to and including that point, with the deepest percentage fall reported. At a new high, the drawdown is zero. It describes the past path of one period; it is not a limit on future falls, which can always be larger.
Is a drawdown the same as losing money? It is an unrealised fall in value while you hold the investment. Whether selling turns it into a realised loss depends on your purchase price: a sale below the peak but above your purchase price is still a realised gain, and only a sale below what you paid realises a loss. But "unrealised" is not a synonym for "safe": if the business fails, the fall can be permanent, including a total loss.
Why do different sources show different drawdowns for the same stock? Usually the basis or the window: price versus total return, a one-year window versus an all-time peak, or a closing-price peak versus an intraday one. The figures can each be correct under their stated basis — which is why the basis and the period belong next to the number.
This article is for educational and informational purposes only. It is not investment, financial, tax, legal, or accounting advice, and it is not a recommendation to buy, sell, or hold any security. All examples are fictional. Past price movements, where any source describes them, do not guarantee or predict future results; verify current filings and figures before making an investment decision.