
Compounding changes the amount on which future returns are calculated. Fees leave less money invested. Inflation changes what the ending balance can buy. Understanding all three helps you read a projection without mistaking it for a promise.
This lesson uses fictional U.S. dollar amounts for simple arithmetic. You can follow it with paper and a calculator. No investment purchase, paid tool, or account is needed.
Stock Metric Lab · Investing foundations
Compounding · Fees · Purchasing power
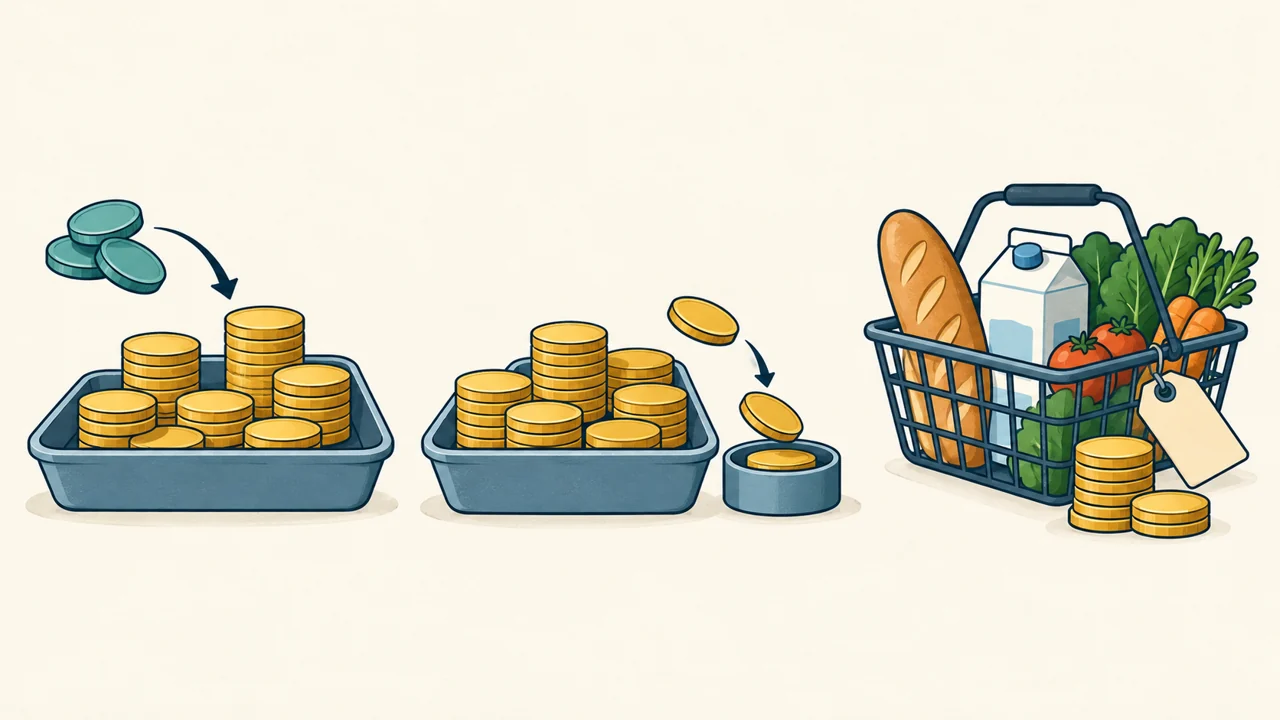
From left: retained returns join a balance, fees leave less invested, and money is separate from what it can buy. Conceptual illustration only; amounts are not to scale.
How compounding changes the starting point
Principal is the starting amount. With compound interest, interest is calculated on principal and previously accumulated interest, as Investor.gov defines it.
Fictional calculation: Start with $1,000 and assume a 5% return each year, with all returns remaining invested. Ignore fees, taxes, and additional deposits for now.
- Year 1: $1,000 × 1.05 = $1,050. The gain is $50.
- Year 2: $1,050 × 1.05 = $1,102.50. The second year’s gain is $52.50.
The extra $2.50 in year 2 comes from applying 5% to the previous $50 gain. Repeating the same calculation for ten years gives:
Ending balance = $1,000 × 1.0510 = $1,628.89
Here, the raised 10 means multiplying by 1.05 ten times. The total gain is about 62.9% over ten years. The assumed annual rate remains 5%. Dividing 62.9% by ten would not give the compound annual rate.
The 5% is an invented assumption. Stocks do not pay a fixed interest rate. Their returns can change or be negative, and dividends are uncertain. Investor.gov explains that stock prices can fall and money can be lost. A smooth calculation does not predict that path. If cash distributions are spent instead of reinvested, they no longer contribute to the invested balance in this model.
Separate your deposits from investment gains
A contribution is money you add yourself. A rising balance may reflect contributions, investment gains, or both.
In a separate fictional two-year example, start with $1,000, assume the same 5% annual return, and add $100 at the end of each year, after that year’s return:
- End of year 1: $1,000 × 1.05 + $100 = $1,150.
- End of year 2: $1,150 × 1.05 + $100 = $1,307.50.
You supplied $1,200 in total. The investment gain is $107.50. Calling the whole $307.50 increase a gain would count your two deposits as investment performance.
Deposit timing matters: the first $100 earns a return in year 2; the second has just arrived. For a balance with no deposits or withdrawals during the period, an annualized compound rate expresses the result as one constant yearly rate compounded over the full period. In the earlier no-deposit example, $1,000 grows to $1,628.89 over ten years because the assumed 5% rate is applied each year. With cash flows during the period, measuring performance needs a method that accounts for their amount and timing. The simple balance comparison above does not calculate that rate.
See why repeated fees affect future growth
Fees reduce the amount left to earn later returns. The SEC’s fee bulletin explains this continuing effect. Some charges occur when you transact; others continue while you hold an investment.
Return to the $1,000, ten-year example with no additional deposits. Assume the same 5% annual return before fees in every case. For this teaching model only, apply one annual fee to the balance after each year’s return:
Next balance = current balance × 1.05 × (1 − annual fee rate)
In this formula, write 0.20% as 0.002 and 1.00% as 0.01.
| Annual fee | After 1 year | After 10 years |
|---|---|---|
| 0% comparison baseline | $1,050.00 | $1,628.89 |
| 0.20% | $1,047.90 | $1,596.61 |
| 1.00% | $1,039.50 | $1,473.14 |
In the 1% case, the first fee is $10.50. Over ten years, fees paid total about $125.77, but the ending balance is $155.75 below the no-fee baseline. The remaining $29.98 is the growth those deducted amounts would have earned under the assumptions.
Actual charging methods differ. A fund’s expense ratio describes annual operating expenses relative to average net assets; those expenses come out of fund assets. It is not necessarily every cost you pay. The SEC’s fund-fee guide explains the disclosures and additional costs. Our once-yearly model is not an exact simulation of a real fund.
Lower fees leave more money when everything else is equal. Real investments can differ in risk, holdings, services, and returns, so this calculation does not identify a product to buy.
Convert the balance into purchasing power
Nominal amounts are the displayed currency amounts. Real amounts adjust for changes in prices. Inflation means rising prices reduce what a unit of money buys. The BLS explanation of consumer prices describes purchasing power and notes that a household’s experience may differ from an average price index.
Assume, separately, that prices rise by a fictional 2% every year for ten years. A fixed basket costing $100 at the start would then cost $121.90. Its price has risen by about 21.9%, because price increases compound too.
The 0.20%-fee example ends with $1,596.61 in nominal dollars. To express it in the purchasing power of dollars at the start:
Real ending balance = nominal ending balance ÷ 1.0210 ≈ $1,309.77
The calculation uses the unrounded nominal balance. It follows the price-index adjustment described in BLS’s explanation of constant dollars. You still have the nominal amount; $1,309.77 describes its purchasing power relative to the starting date.
For the same period, the exact inflation adjustment to a return is:
Real return = (1 + nominal return after fees) ÷ (1 + inflation rate) − 1
Use decimal rates in this formula: 4.79% is 0.0479 and 2% is 0.02.
In our annual model, the 0.20% fee leaves a 4.79% nominal return. With 2% inflation, the real return is about 2.74%. Simply subtracting inflation is an approximation. If prices rise faster than the after-fee balance, purchasing power falls even while the displayed balance grows.
These are assumptions, not forecasts of inflation or returns. The arithmetic works in other currencies when amounts and price changes are consistently measured in that currency. Currency conversion and taxes are outside this exercise.
Practice without committing money
Use the free Investor.gov compound-interest calculator with fictional inputs: initial amount $1,000, monthly contribution $0, ten years, estimated annual rate 5%, and annual compounding. Record the result as a hypothetical calculation.
Then use this lesson’s fee formula to compare the 0.20% and 1% cases. Finally, divide one ending balance by 1.0210. Write three separate labels: money contributed, balance after fees, and purchasing power at the starting date. Completing those distinctions is the exercise’s goal.
Check your understanding
- Is an assumed 5% rate a promise? No. It is an input to a fictional calculation.
- Does adding $100 count as a $100 investment gain? No. It is your contribution.
- Is every dollar of the ten-year fee gap a fee paid? No. The gap also includes foregone growth in this model.
- Does a higher nominal balance always buy more? No. Prices may have risen faster.
Continue with a clear question
Connect the calculation to your money-plan lesson. For the structures behind fund costs, return to stocks, mutual funds, and ETFs. For uncertainty that a calculator cannot remove, review investment risk and diversification.
Educational content only, not a recommendation to buy, sell, or hold an investment. Investing involves risk, including possible loss of principal. All worked examples are fictional and exclude taxes. U.S. sources illustrate concepts; local products, disclosures, and rules can differ. Sources checked October 13, 2026.