
Only if its cash-flow definition matches the calculator and the starting period is suitable for your forecast. Stock Metric Lab’s free DCF calculator uses free cash flow to the firm (FCFF), discounted at the weighted average cost of capital (WACC). A reported or calculated operating-cash-flow-minus-capex figure needs a reconciliation before it can serve as that input.
Microsoft’s FY2026 statements provide a useful example of the first calculation. A separate fictional company below shows the calculator mechanics. The fictional inputs and results do not estimate Microsoft’s value.
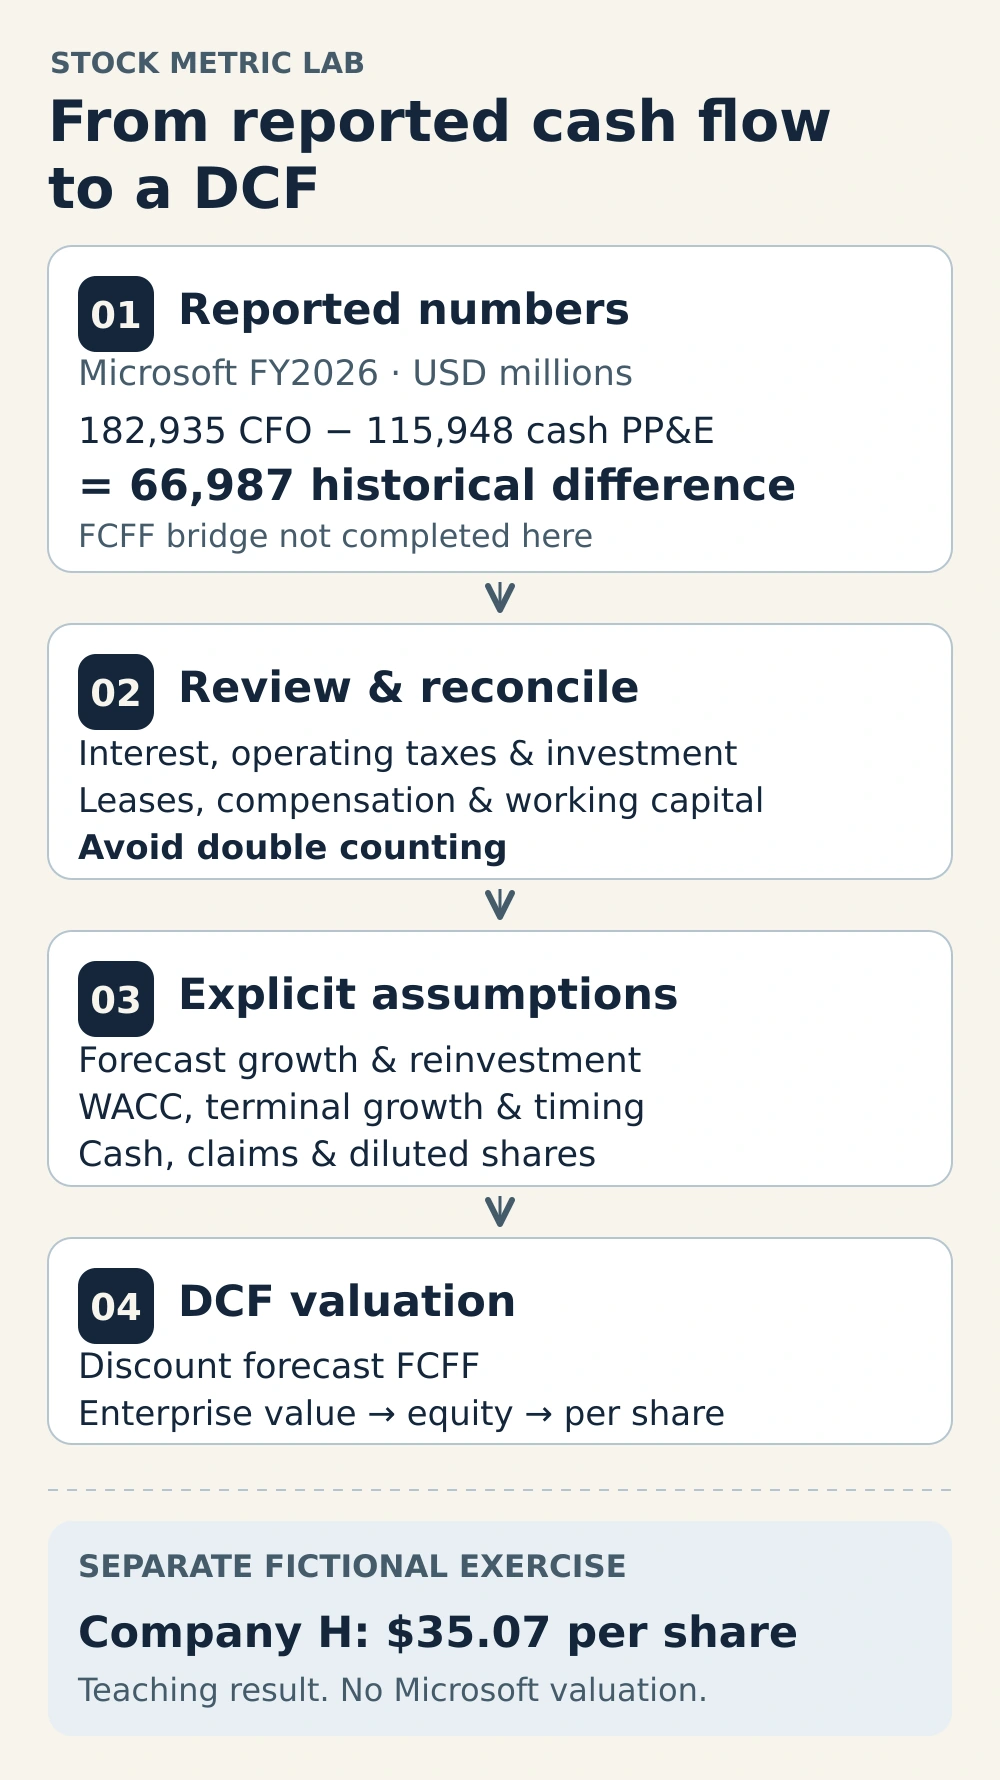
Microsoft FY2026: what the cash-flow statements establish
Use the annual column for the fiscal year from July 1, 2025 to June 30, 2026. Microsoft’s audited FY2026 Form 10-K cash-flow statement, printed page 53, reports the following amounts. The annual column of its July 29, 2026 earnings release contains the same figures. Here, CFO means cash flow from operations, and PP&E means property, plant and equipment.
| Item | Amount | Status |
|---|---|---|
| Operating cash flow | 182,935 | Reported |
| Cash additions to property and equipment | 115,948 | Reported spending magnitude |
| CFO minus cash PP&E spending | 66,987 | Our calculation |
182,935 − 115,948 = 66,987 million dollars, or approximately $67.0 billion. The investing statement shows the equipment spending as a negative outflow; the subtraction above uses its positive magnitude.
This establishes a historical cash-flow difference. The two lines alone do not establish Microsoft’s FCFF, sustainable future cash flow, or fair value. For business context, read the Microsoft stock analysis; for the broader definitions, use the free cash flow guide.
Build the operating cash flow the model needs
FCFF measures operating cash available to debt and equity investors after operating taxes and reinvestment, before financing payments. One construction starts with operating profit, applies taxes as if there were no financing-interest deduction, adds appropriate noncash operating charges, and subtracts operating investment and increases in noncash operating working capital. Damodaran’s cash-flow explanation sets out that framework and the interest-tax distinction.
Noncash operating working capital includes items such as receivables and inventory, less operating liabilities. The starting point matters. CFO already includes working-capital movements and noncash adjustments. Subtracting the same working-capital increase again, or adding depreciation again, would count those effects twice. An operating-profit-based construction needs those steps because they have not yet been included.
Keep cash purchases and lease-funded investment consistent
Microsoft’s lease disclosures in Note 13, printed page 78, separately identify assets obtained through finance leases. Those noncash additions are outside the cash PP&E line used above.
If you treat finance leases as debt financing, reflect leased-asset investment in reinvestment and use matching interest and debt-claim adjustments. Do not also deduct later principal repayments as a second investment charge. If a management capex measure already includes lease additions, adding them again creates another overlap. Operating leases require a consistent approach too; adding their liabilities to debt while leaving operating cash flow unchanged can mix conventions.
Cash PP&E spending can also differ from operating investment when purchases remain unpaid or other investing lines contain operating assets. Separate capital creditors from operating working capital and avoid counting the same investment twice.
Check interest, taxes and recurring employee compensation
A CFO-based bridge must identify financing interest actually deducted from operating cash flow and its associated tax benefit. Cash interest paid, expensed interest and capitalized interest can differ. Microsoft’s Note 3 interest expense already includes finance-lease interest, so adding both amounts would overlap. Similarly, a consolidated book tax rate does not automatically measure normalized taxes on unlevered operations.
Stock-based compensation also needs an explicit treatment. CFO adds back this noncash expense, but recurring employee compensation has an economic cost. If you retain it as an operating expense in a CFO-based forecast, reverse its relevant CFO add-back. If operating profit already includes it, do not subtract it again. Another approach models its future share or cash consequences consistently. Charging the same future awards as both an expense and extra dilution would double count them. Existing outstanding awards still need a separate valuation-date claims check.
These checks require the statements and notes, plus analyst judgments. We have not completed a numerical Microsoft FCFF bridge or estimated its WACC here. The $66,987 million historical difference therefore stays outside the calculator exercise.
Fictional Company H: calculator mechanics
Every number in this section is invented for teaching. It is unrelated to Microsoft’s valuation. All monetary inputs are USD millions; the share count is millions of shares. The valuation date is the end of hypothetical year zero, with projected cash flows received at each year-end.
Assume year-zero operating profit of 1,800 after recurring employee compensation, a 25% normalized operating tax rate, depreciation and amortization of 350, operating capital investment of 600, and a 100 increase in noncash operating working capital. Assume no leases or other required operating adjustments.
Starting FCFF = 1,800 × (1 − 25%) + 350 − 600 − 100 = 1,000. Only depreciation and amortization is added back in this simplified example. Employee compensation remains an operating cost; it is not subtracted again.
Enter the complete assumptions
In the free DCF calculator, select USD and enter:
| Calculator input | Value |
|---|---|
| Current annual FCFF | 1,000 million dollars |
| Annual FCFF growth | 6% |
| Forecast years | 5 |
| WACC | 9% |
| Terminal growth | 3% |
| Cash and non-operating assets | 2,000 million dollars, assumed excess/non-operating |
| Debt and debt-like claims | 4,000 million dollars |
| Diluted shares outstanding | 500 million shares |
| Current share price | Leave blank |
The cash, claims and share count are valuation-date assumptions. The simplified fixed share count incorporates existing equity claims. WACC and both growth rates are teaching assumptions, with no Microsoft or current-market estimate implied. Changing the display currency only changes labels; it does not convert amounts.
Follow the timing and the equity bridge
The 1,000 starting FCFF is year zero. Year one is 1,000 × 1.06 = 1,060, discounted for one year at 9%. Year five reaches approximately 1,338.23. Terminal cash flow begins in year six, so terminal value at the end of year five is 1,338.225578 × 1.03 ÷ (0.09 − 0.03) = 22,972.87. Terminal growth must remain below WACC.
| Output | Amount |
|---|---|
| Present value of years one through five | 4,602.00 |
| Present value of terminal value | 14,930.79 |
| Enterprise value | 19,532.79 |
| Equity value: enterprise + 2,000 − 4,000 | 17,532.79 |
| Value per fictional diluted share: equity ÷ 500 | $35.07 |
The terminal value contributes approximately 76.4% of enterprise value. Holding the other inputs fixed, changing WACC to 8% gives $42.98 per share; 10% gives $29.41. These sensitivities show why a rounded discount-rate guess can drive the answer. They do not provide a stock price target.
Before entering a real company
Keep a short record of what is reported, what you calculated, and what you assumed:
- Identify the source period, units and exact cash-flow definition.
- Reconcile financing costs, operating taxes, investment, leases and compensation.
- Tie forecast growth to margins and the reinvestment needed to support it.
- Use valuation-date excess cash, debt-like claims and equity claims consistently.
- Document WACC separately and test terminal-value sensitivity.
The free calculator is enough to run this exercise. The optional DCF Comparison Workbook can help organize previous and current assumptions; you enter and save those snapshots manually.
Educational use only. This article is not investment advice or a recommendation to buy or sell any security. The fictional result demonstrates a model; a real valuation needs a completed, dated reconciliation and forecast.