
AMD reported fiscal third-quarter 2026 results on November 3, 2026, for the quarter ended September 26. Revenue reached $13.377 billion, up 45% year over year and 16% sequentially. Data Center led the growth, and operating margins improved. Cash conversion weakened: company-defined free cash flow fell to $554 million, a reported 4% margin.
The six checks below revisit the questions in our pre-results preview. The conclusion is mixed: AMD exceeded its revenue range and met its non-GAAP gross-margin guide, while working capital absorbed more cash. This review uses AMD’s earnings release and earnings presentation; it does not incorporate unverified conference-call remarks.
Q3 2026 actual results
USD millions except diluted EPS and percentages. Margins and growth rates are rounded as AMD reports them. Non-GAAP measures supplement GAAP results and exclude costs that still matter to shareholders.
| Metric | GAAP | Non-GAAP |
|---|---|---|
| Revenue | $13,377 | $13,377 |
| Gross margin | 54% | 56% |
| Operating expenses | $4,378 | $3,560 |
| Operating income | $2,832 | $3,923 |
| Operating margin | 21% | 29% |
| Net income | $2,428 | $3,471 |
| Diluted EPS | $1.46 | $2.09 |
AMD reports three operating segments. Client and Gaming includes $2.949 billion of Client revenue, up 7% year over year, and $773 million of Gaming revenue, down 40%.
| Segment | Revenue | YoY change | Operating income |
|---|---|---|---|
| Data Center | $8,546M | +97% | $2,882M |
| Client and Gaming | $3,722M | −8% | $573M |
| Embedded | $1,109M | +29% | $453M |
The three segment profits, less the $1.076 billion All Other operating loss, reconcile to consolidated GAAP operating income of $2.832 billion. Source: AMD’s financial and segment tables.
How the six checks turned out
1. Revenue: above the company’s guidance range
AMD had guided Q3 revenue to approximately $13.0 billion, plus or minus $300 million. The $13.377 billion result exceeded the $13.3 billion upper bound by $77 million, or 0.6%. It was $377 million, or 2.9%, above the midpoint. Those differences are SML calculations, with the upper-bound and midpoint comparisons kept separate. Source: previous company guidance.
2. Data Center: a larger contribution, with the half-year test still open
Data Center revenue of $8.546 billion rose 97% year over year and 27% sequentially. Its share of total revenue increased to 63.9%, from 58.2% in Q2, by SML’s calculation. Growth was led by this segment rather than the smaller businesses.
Data Center includes EPYC server CPUs alongside Instinct accelerators, so its revenue share is not an AI-only revenue ratio. On the Q2 earnings call, page 13, management defined second-half acceleration by comparing the second half’s year-over-year Data Center growth with the first half’s. Q3 supplies only part of that evidence. The full-half test remains open until Q4 is reported.
3. Gross margin: the guide was met
Non-GAAP gross margin was 56%, matching AMD’s approximate Q3 guide and the Q2 level. GAAP gross margin was 54%. The higher Data Center mix therefore coincided with a stable company-wide gross margin. That does not establish Helios-specific profitability: AMD does not disclose a separate Helios margin, and changes elsewhere in the product mix can offset systems-ramp costs.
4. Operating leverage: improved on both accounting bases
Non-GAAP operating income rose 27% sequentially to $3.923 billion, faster than revenue’s 16% increase. Its reported margin rose from 27% to 29%. Non-GAAP operating expenses were $3.560 billion, $90 million below the approximate $3.65 billion outlook in the Q2 presentation, page 17. Data Center’s segment operating margin reached 33.7%, versus 31.3% in Q2, by SML’s calculation.
GAAP operating margin also improved, from 17% to 21%. The $523 million of stock-based compensation excluded from non-GAAP earnings remains an economic cost to shareholders. At the net-income level, GAAP results included a $1.097 billion customer-warrant fair-value remeasurement expense and a $555 million income-tax benefit. The warrant expense is excluded from non-GAAP earnings and is not an operating cash payment. These items make EPS alone an incomplete measure of operating progress.
5. Helios and Instinct: deployment progress, no separate revenue figure
AMD’s release says Anthropic, Meta, Microsoft, OpenAI and Oracle Cloud Infrastructure are running models and workloads on initial Helios systems. This adds deployment evidence to the earlier installation-and-testing milestone. However, the release and presentation do not provide standalone Helios revenue or an Instinct-only revenue split. Customer usage, installation and planned capacity cannot be treated as disclosed recognized revenue. For this review, the quantified financial evidence remains at Data Center segment level.
6. Free cash flow: conversion deteriorated
Operating cash flow from continuing operations was $1.202 billion. Subtracting $648 million of capital expenditure gives AMD-defined free cash flow of $554 million. Its reported 4% margin was below Q2’s 14% and far below the first-half 19% reference used in the preview. That 19% was an SML observation criterion, not AMD guidance.
The cash-flow statement records $1.928 billion absorbed by receivables, $2.995 billion by inventories and $1.070 billion by prepaid expenses and other assets. Accounts payable supplied a $2.313 billion offset. These are cash-flow-statement movements, not direct balance-sheet changes or proof of impaired receivables or inventory. CapEx declined from Q2’s $808 million, so higher capital spending does not explain the sequential FCF deterioration. Nine-month FCF was $4.678 billion, a reported 13% margin.
Cash and short-term investments rose to $15.776 billion, while total debt increased to $7.079 billion. Cash and investments less debt therefore fell to $8.697 billion from $9.885 billion in Q2, by SML’s calculation. This simple subtraction excludes leases, warrant liabilities and other obligations. The presentation, page 13, identifies a $4.75 billion senior-notes offering completed in August. A larger cash balance alone is not evidence of stronger internally generated cash flow.
Q4 outlook: faster revenue growth, a lower gross-margin guide
AMD expects approximately $17 billion of Q4 revenue, plus or minus 3%. That implies a $16.49 billion to $17.51 billion range by calculation. AMD describes midpoint growth of approximately 66% year over year and 27% sequentially. It guides non-GAAP gross margin to approximately 55% and non-GAAP operating expenses to approximately $3.75 billion. These are forecasts, not actual results. Sources: Q3 release and Q3 presentation, page 17.
The next questions are whether the systems ramp converts working-capital investment into collections, how the product mix affects gross margin, and whether Q4 completes the second-half Data Center growth test. The one-point reduction in the gross-margin outlook warrants attention, but the forecast alone does not identify its cause. This review makes no stock-price forecast or buy/sell recommendation.
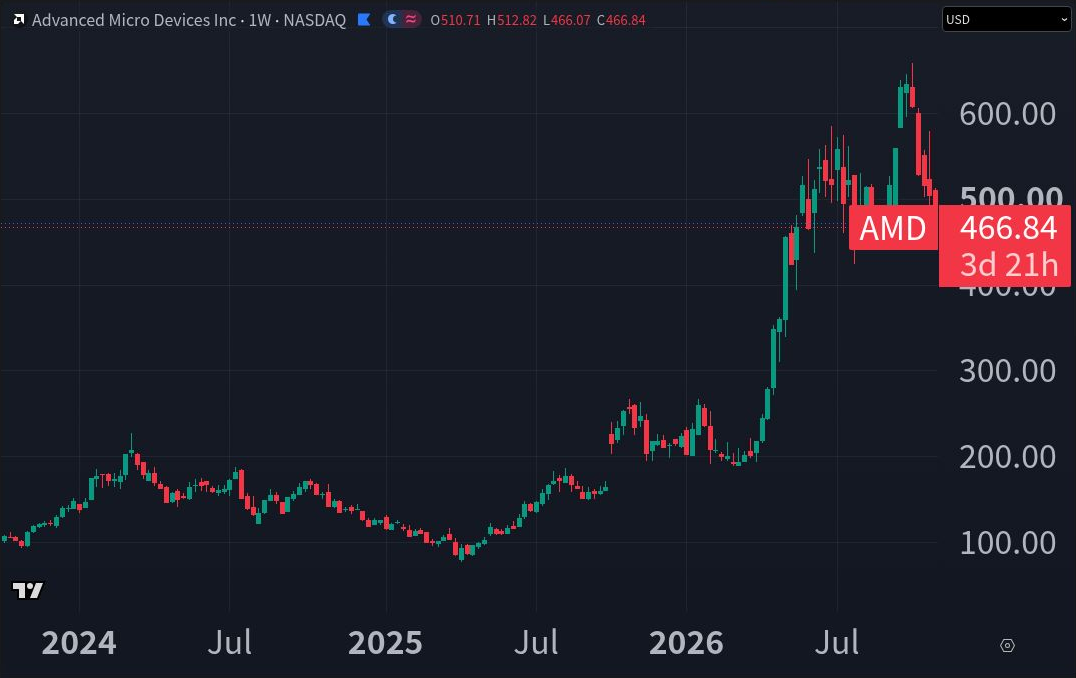
Weekly chart context: captured before the release
Sources and further reading
Primary sources: AMD Q3 2026 release and financial tables; Q3 earnings slides; Q2 release and prior guidance; Q2 earnings slides, page 17; and Q2 call transcript, page 13. Calculated ratios use the reported dollar figures. This article was updated from its pre-results preview after AMD’s November 3 release.
For background, see our AMD business and valuation framework, Nvidia, AMD and Broadcom comparison, and AI capex comparison. Those background articles have their own dated measurement periods and are not substitutes for the Q3 figures above.
Educational information only, not personalized investment advice or a recommendation to buy, sell or hold any security. Company-defined non-GAAP measures may differ from those of other businesses.