
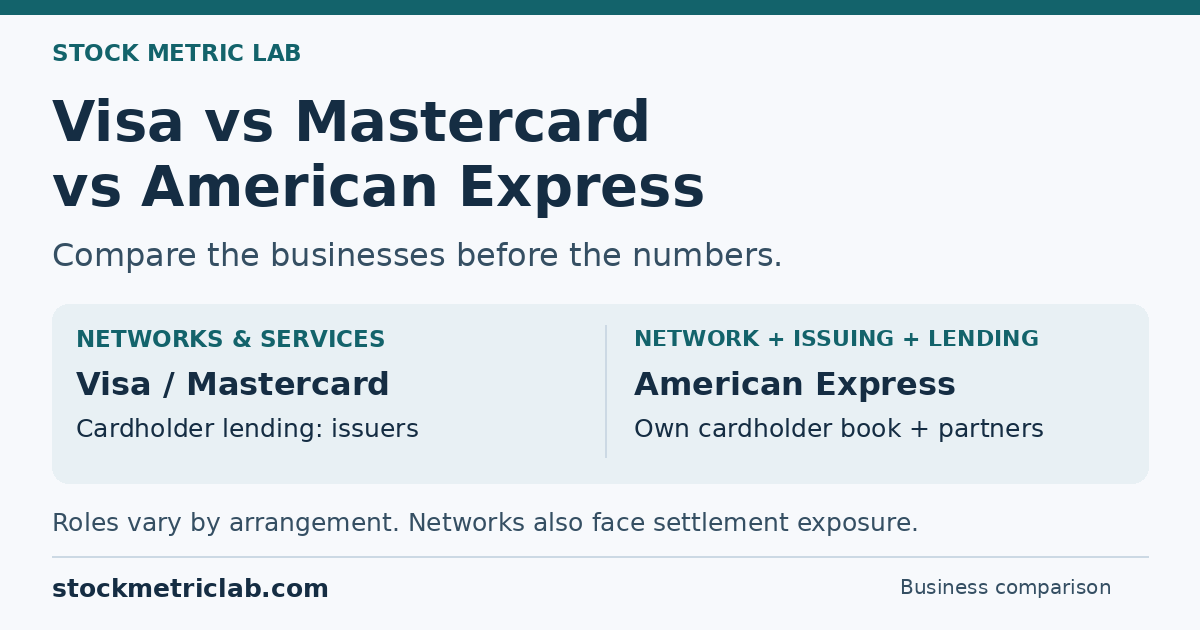
Visa, Mastercard and American Express all appear on payment cards, but their financial statements describe different combinations of businesses. Visa and Mastercard provide a closer network-to-network comparison. American Express adds substantial card issuing, lending and deposit funding, so the same revenue or cash-flow ratio can answer a different question.
This guide explains what to compare before comparing the numbers. It also places other international and regional card brands in context. The objective is a usable reading framework, not a universal winner or a recommendation to buy any stock.
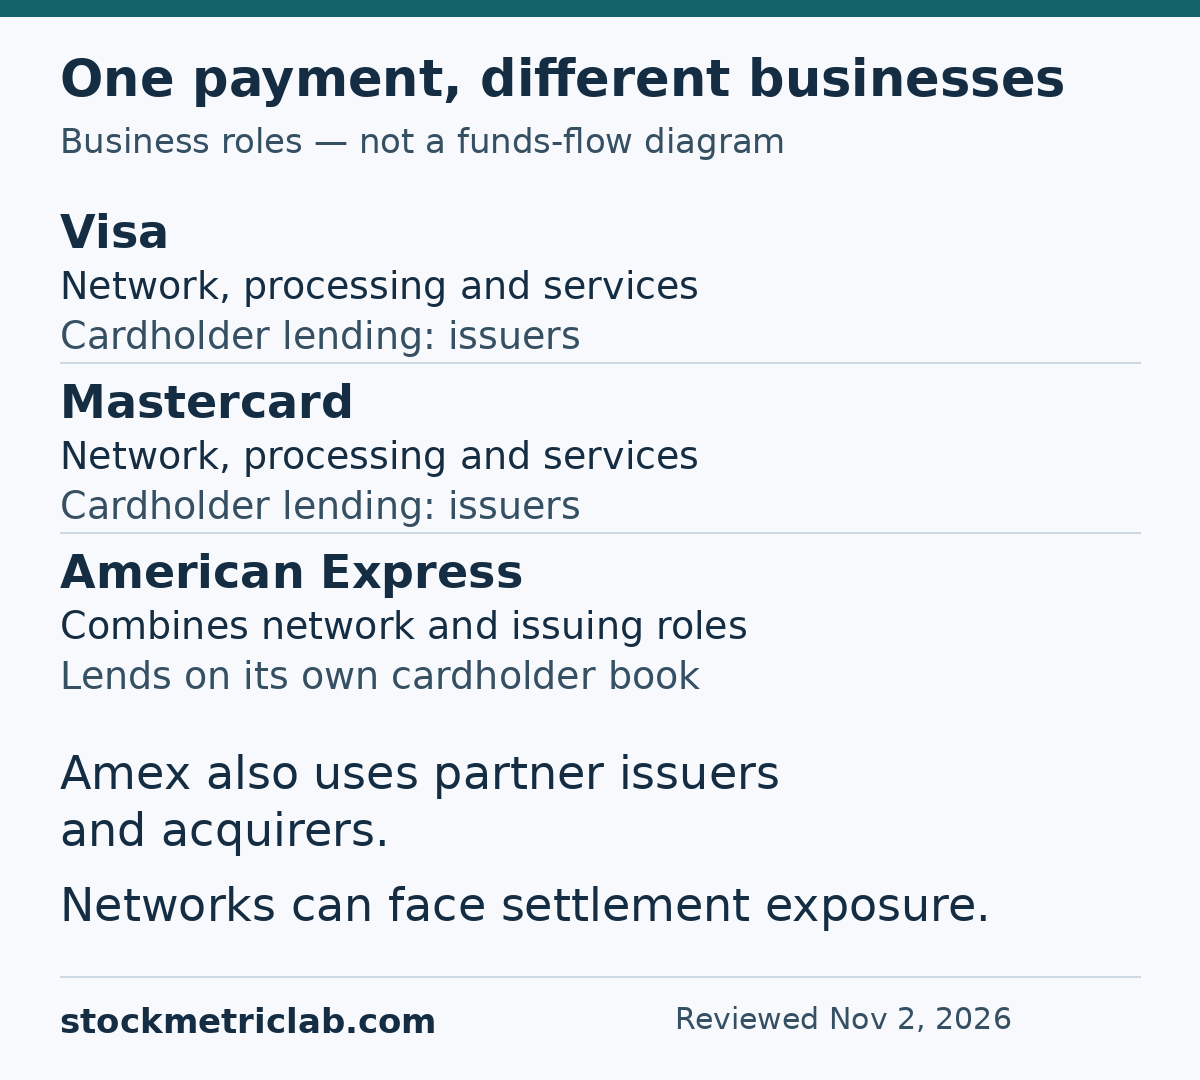
Business roles, not the timing or direction of cash movements. American Express also uses partner issuers and acquirers; the issuer determines who carries a particular cardholder loan. Networks can face settlement exposure, which differs from cardholder credit risk. Source: the company filings linked below.
Start with the jobs behind a card payment
A card transaction involves several roles:
- The issuer provides the card and manages the cardholder account.
- The acquirer connects the merchant to card acceptance and settlement arrangements.
- The network connects participants and supports authorization, clearing and settlement.
- The lender, where credit is provided, finances the balance and bears the associated borrower risk.
These are business roles, not four mandatory independent companies. One group can perform several of them. A diagram connecting the roles also should not be mistaken for a diagram of when cash moves.
Visa describes itself as a payments technology company rather than a card issuer or lender. Its fees are distinct from interchange, which generally passes from acquirers to issuers, and from the merchant’s total acceptance charge. Counting the whole merchant fee as Visa revenue would therefore overstate what belongs to the network. Visa FY2025 Form 10-K.
Mastercard likewise does not issue cards or extend credit to cardholders. Its business also includes services and payment capabilities beyond the familiar card transaction. A “network company” description is useful, but should not imply that every revenue dollar comes from an identical processing fee. Mastercard FY2025 Form 10-K.
American Express can combine network, acquiring, issuing and lending roles. However, partner issuers and third-party acquirers also participate. The issuer’s identity matters: an Amex-branded card does not establish that American Express itself carries every related loan. Nor does a third-party merchant acquirer remove Amex’s lending exposure on an Amex-issued card. American Express FY2025 Form 10-K.
Define the comparison before filling the table
Use this matrix as a set of questions, rather than a scoring system.
| Question | Visa and Mastercard | American Express |
|---|---|---|
| What business is being measured? | Network activity and the services included in each company’s reporting | Network, merchant and cardholder relationships, plus lending |
| What does revenue include? | Identify the categories and deductions before comparing growth | Identify fees, interest income and interest expense before comparing growth |
| What supports earnings? | Test volume, pricing, mix, incentives and operating costs | Also test rewards, funding costs and credit-loss provisions |
| What does cash generation mean? | Match operating cash flow and capital-spending definitions | Examine loan growth, funding and capital alongside operating cash flow |
| What must remain separate? | Cardholder borrowing versus network exposure | Proprietary issuing versus partner arrangements |
The analytical implication is straightforward: a broader revenue base is not automatically a better business, and a higher margin is not automatically a better investment. First establish which activities sit inside the reporting boundary. Only then ask whether growth and profitability are improving on a consistent basis.
Keep a short definition beside every metric in your notes. “Revenue,” “volume” and “cash flow” are headings, not complete definitions.
Use one calendar quarter without pretending everything matches
The quarter ended September 30, 2026 offers a common calendar window. It is Visa’s fiscal fourth quarter and Mastercard’s and American Express’s third quarter. Label the dates explicitly rather than placing “Q4” beside “Q3” without explanation. The relevant sources are Visa’s October 27 release, Mastercard’s September-quarter filing and Amex’s October 23 release.
Even that alignment has limits. Visa’s service revenue uses prior-quarter payments volume, while other categories reflect current-quarter activity. Its processed-transaction count measures transactions, not dollars spent. Its cross-border measure excluding intra-Europe also has a different boundary from total cross-border volume. Visa’s metric definitions.
Mastercard’s assessments reflect standard pricing and are not net revenue. Its local-currency and U.S.-dollar growth measures answer different questions. Mastercard’s revenue discussion.
Also avoid ranking incentive ratios without checking the calculation. The ratios calculated in SML’s Visa analysis and Mastercard analysis use different denominators: total pre-incentive revenue for Visa versus pre-incentive payment-network revenue for Mastercard. They are not interchangeable. The source inputs are in Visa’s release and Mastercard’s filing.
American Express reports total revenue net of interest expense. Its quarter also includes adjustments related to the Global Business Travel Group stake sale and restructuring. Keep GAAP earnings, adjusted earnings and the reconciliation visible rather than choosing whichever growth rate looks strongest. Amex’s reported and adjusted results.
A practical comparison rule: record the period, currency basis, business boundary and adjustment policy before copying a growth percentage. A missing definition is a reason to pause the comparison, not to fill the gap with an assumption.
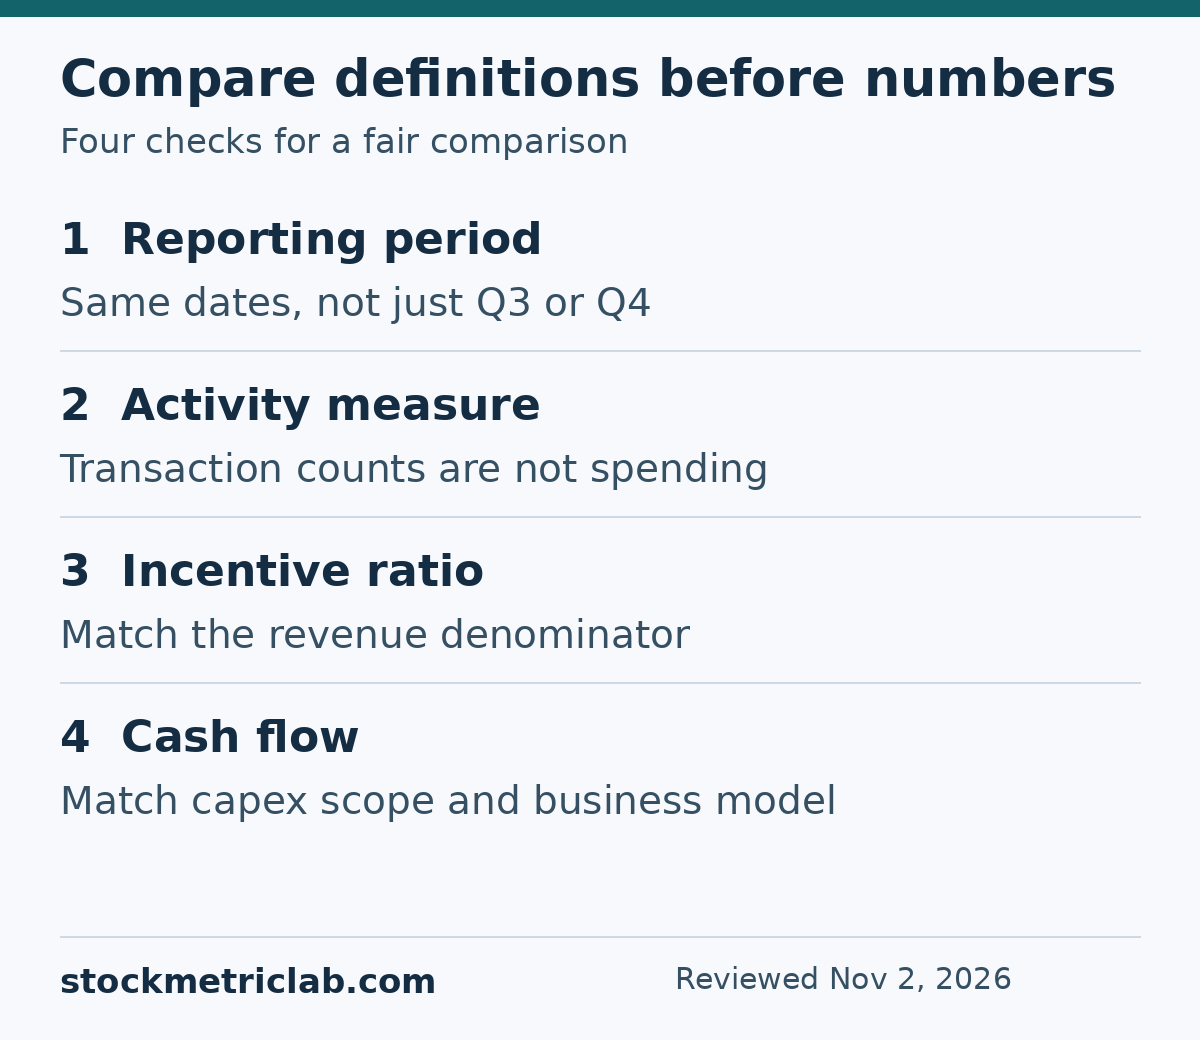
An analytical checklist, not company-reported scores or a ranking.
Compare growth within the right boundaries
A useful first comparison is each company’s current period against its own comparable prior period. After that, investigate why the rates differ across companies.
Ask whether the apparent advantage survives three checks:
- The activity check: are you comparing spending value, transaction count or revenue?
- The scope check: do geography, product coverage and acquired businesses match?
- The translation check: are both growth rates reported in dollars, or both adjusted for currency movements?
For example, revenue growing faster than transaction count is a question about the revenue bridge. It does not, by itself, prove a particular price increase. Investigate mix, services, contract terms and the disclosed accounting basis before drawing that conclusion.
Similarly, a larger services category does not automatically establish a stronger services business. Start with the activities included, whether the reporting boundary changed, and what the company actually discloses about profitability. If the evidence cannot support a clean like-for-like comparison, leave the conclusion narrower.
Cash flow needs a separate reading method
For a network business, operating cash flow less clearly defined capital spending can be a useful first-pass calculation. Write down whether software and other investment items are included, and use identical periods. A twelve-month amount should not be ranked against a nine-month amount.
For American Express, the cash-flow statement also records lending and funding. Loan-book growth appears in investing activity, while deposits and borrowing appear in financing. Operating cash flow minus capital expenditure therefore leaves out essential parts of how this business deploys and obtains funds. Amex’s cash-flow statement.
A large calculated cash remainder is not a substitute for reviewing credit quality, liquidity and capital requirements. Equally, funding loan growth should not be treated as if it were an ordinary manufacturer’s equipment purchase. The economic purpose of the movement matters as well as its accounting label.
For the mechanics, read SML’s three financial statements guide and free cash flow guide. These explain the calculation and its limitations; they do not make a bank-like balance sheet directly comparable with a network.
Use two checklists rather than one league table
For network economics:
- Separate activity growth from revenue growth.
- Check whether incentives and customer agreements change the conversion into net revenue.
- Read expenses and investment needs alongside operating leverage.
- Investigate legal, regulatory, operational and settlement exposures; “not a cardholder lender” does not mean “risk-free.”
- Review the assumptions required to justify the valuation, rather than treating a strong business model as sufficient evidence about the stock price.
For issuing and lending economics:
- Follow spending, card fees and customer retention alongside the cost of rewards and benefits.
- Separate interest income from the cost of obtaining funding.
- Review delinquencies, write-offs, provisions and reserves together.
- Ask how loan growth would be funded under a less favorable scenario.
- Examine capital and liquidity before interpreting distributions to shareholders as freely repeatable.
These are research questions, not numerical pass marks. Record what changed, the source that explains it, and what would challenge your interpretation. That produces a more useful conclusion than awarding the highest score to whichever company leads the most columns.
Other payment brands and who operates them
The broader market includes other international brands and regional networks. This is a representative map, not an acceptance ranking or an exhaustive list. The official sources below were reviewed on November 2, 2026. A brand, its owner, the local card issuer and an investable listed company can be different entities.
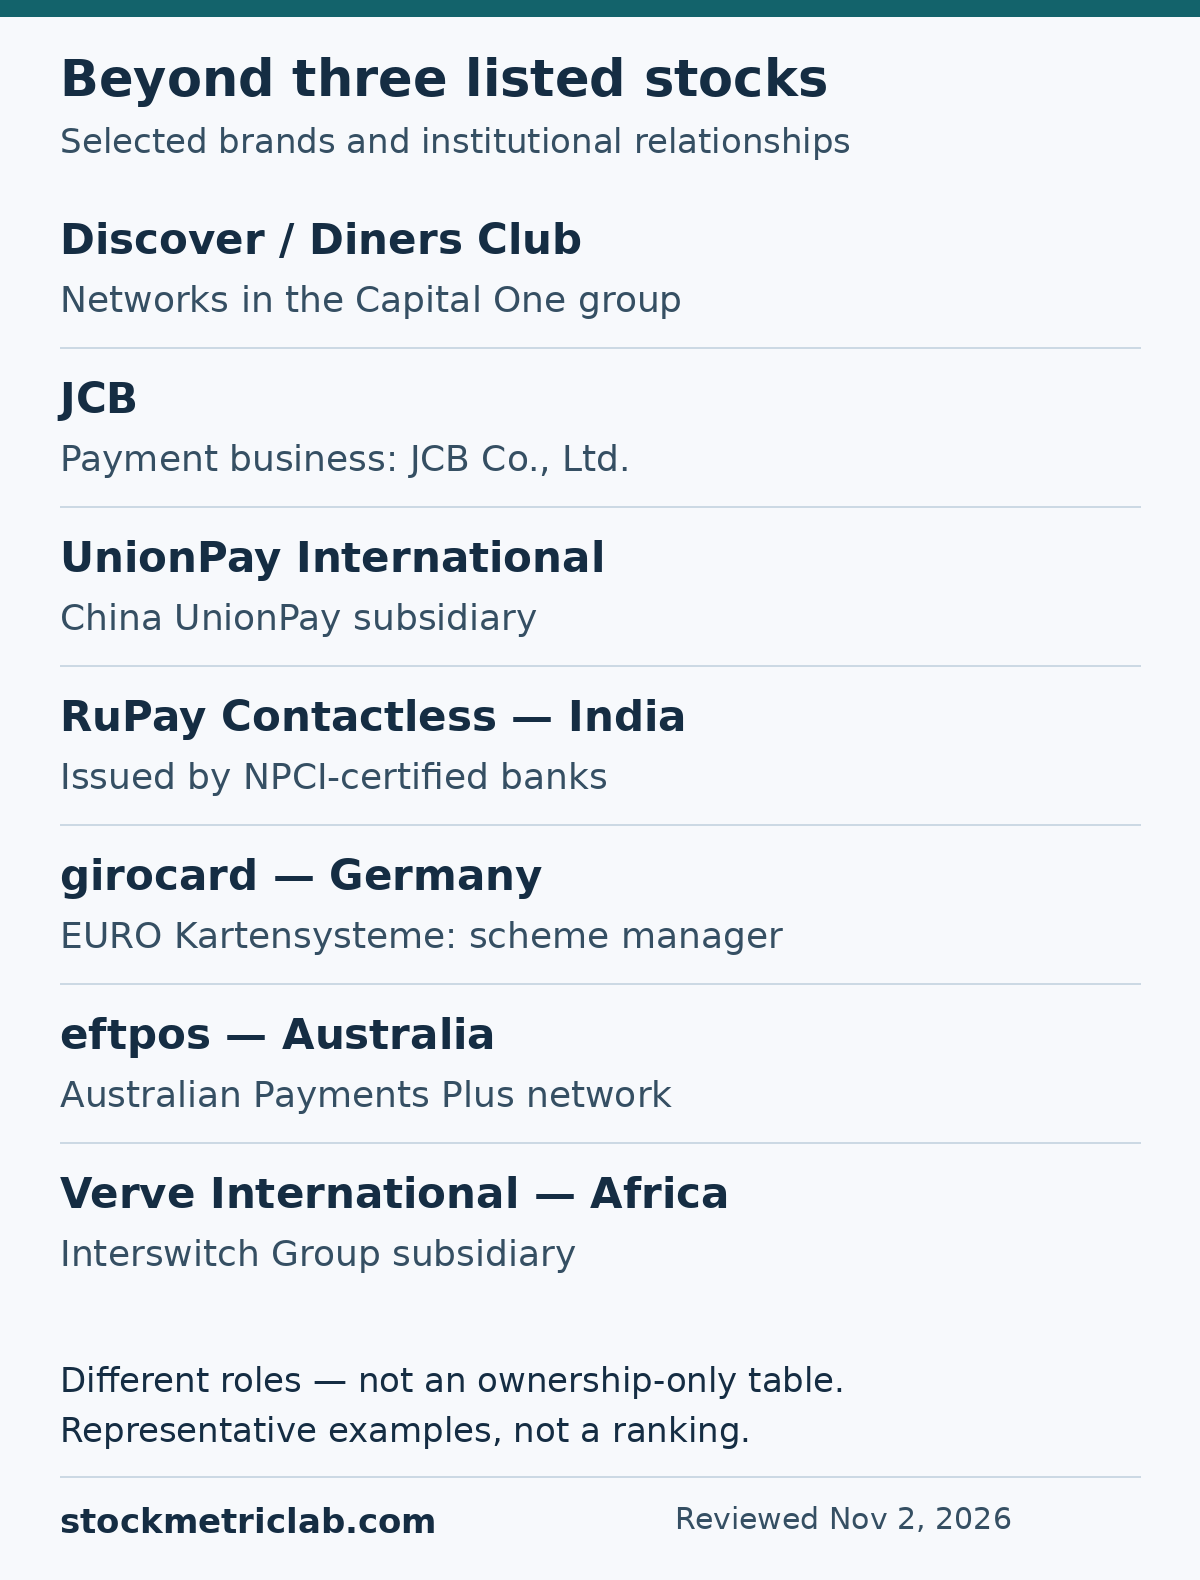
Representative examples checked November 2, 2026, not an exhaustive directory or an ownership-only table. Deutsche Kreditwirtschaft sets girocard governance; EURO Kartensysteme is its operational scheme manager. Primary sources appear with each entry below.
Discover and Diners Club International
Capital One completed its acquisition of Discover in May 2025. Its announcement includes the Discover, PULSE and Diners Club International networks. Capital One is listed as NYSE: COF, so describing this group as simply “unlisted” would be misleading. Capital One’s completion announcement.
Diners Club’s international licensees issue cards and maintain acceptance relationships. Distinguish the network owner from the local institution behind a particular card. Capital One FY2025 Form 10-K.
JCB and UnionPay
JCB is the payment business JCB Co., Ltd. Its official overview lists credit-card operations and related services, financing and multiple major shareholders, with the shareholder list dated July 2026. That ownership list should not be shortened to a claim that one bank owns the whole business. JCB corporate overview.
UnionPay International describes itself as a subsidiary of China UnionPay focused on international business. Keep that subsidiary distinct from the parent and from similarly named service providers when tracing a brand’s ownership and activities. UnionPay International’s introduction.
Regional examples
In India, RuPay Contactless includes debit, credit and prepaid variants. NPCI’s support documentation says banks certified by NPCI can issue these cards. This illustrates a distinction that also matters elsewhere: the scheme and certification framework are separate from the bank issuing a particular card. NPCI card-variant guidance; NPCI issuer-certification guidance.
In Germany, girocard has Deutsche Kreditwirtschaft as its governance authority and EURO Kartensysteme as its operational scheme manager. The scheme-management role should be distinguished from card issuance. EURO Kartensysteme.
In Australia, eftpos is the domestic debit network within Australian Payments Plus. A multi-network debit card can support eftpos and an international network, with routing arrangements determining which is used. Here, eftpos means the particular network, not every payment terminal. AP+ network overview; routing explanation.
In Africa, Verve International is a card scheme and token brand, and a subsidiary of Interswitch Group. It provides another example of why identifying the group behind the brand matters. Interswitch’s 2026 description.
Keep wallets and account-to-account payment systems in separate categories. A checkout screen can present several payment methods together without making them the same kind of business. Likewise, more than one network brand can coexist on a card; logos alone do not reveal the route taken by every payment.
Read the price chart alongside the business comparison
The chart adds a market-price perspective to the business differences above. Over this specific window, American Express had the largest price increase, followed by Visa and Mastercard. The result depends on the chosen dates and does not establish which company offers the best future return.
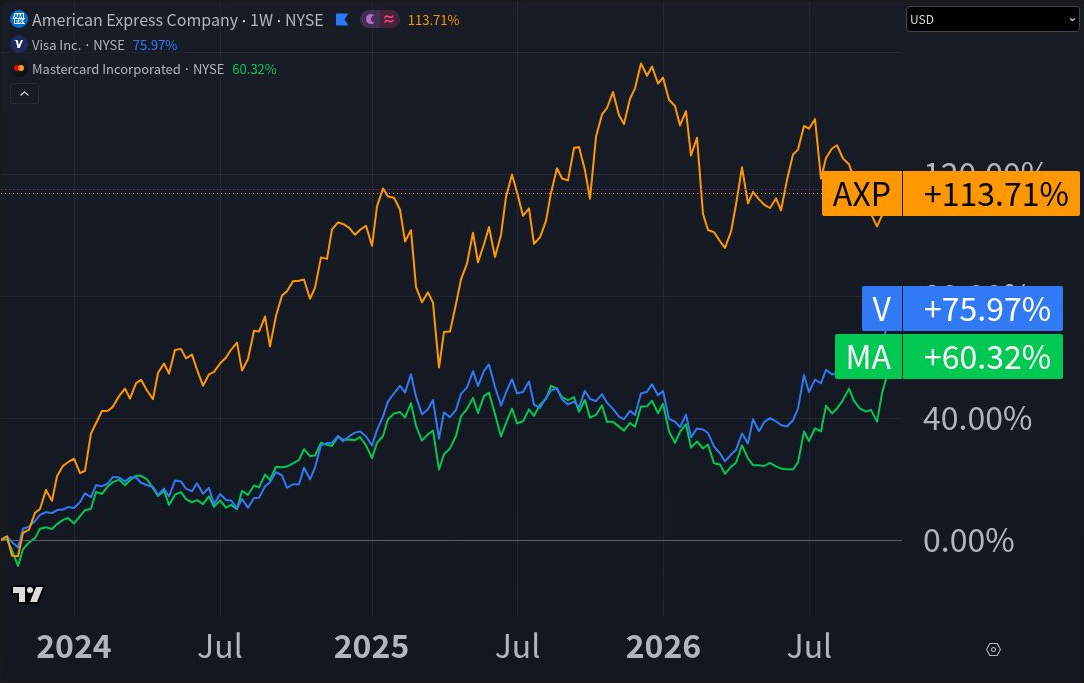
Source: TradingView, Cboe One market data; NYSE-listed V, MA and AXP, in USD, using weekly closing prices. Comparison period: the week-ending October 6, 2023 close through the week-ending October 30, 2026 close. Observed on November 2, 2026 (JST). Prices are split-adjusted and are not dividend-adjusted. This is price change, not total return; it excludes dividend reinvestment. TradingView attribution is retained in the original screenshots.
Use the chart as context, not as a standalone buy or sell signal. Past price performance does not predict future returns. Review valuation, business quality, financial evidence and risk alongside the chart. For the method and its limits, see our relative performance guide and TradingView weekly review guide.
Choose the next question before the next stock
Use the individual analyses for the detailed company evidence:
- Visa stock analysis for its revenue model, operating performance and risks.
- Mastercard stock analysis for its network and services reporting.
- American Express stock analysis for fees, lending, funding and credit risk.
Finish your comparison with one sentence about the business difference, one about the evidence that can fairly be compared, and one about the remaining uncertainty. A defensible conclusion may be that two figures should not be ranked at all. That is a useful result when it prevents a confident answer to the wrong question.
Educational content only, not personalized investment advice. Investing involves risk, including possible loss of principal.