
Summary: Dividend yield relates a dividend to a share price. Earnings payout and historical free cash flow coverage examine different parts of the company’s finances. Read them together, check their calculation bases, and avoid treating any single ratio as a promise of future income.
What a dividend is
A dividend distributes part of a company’s profits to shareholders. Companies that pay dividends often follow a regular schedule, but they can also make unscheduled special payments. Investor.gov’s dividend definition explains this distinction.
This guide focuses on cash dividends on common shares. It explains how to read the numbers, rather than how to choose a stock. A company need not pay common dividends, and payments can be reduced or eliminated. Past payments do not guarantee future income. FINRA’s stocks guide explains this uncertainty.
What dividend yield measures
Dividend yield = annual dividend per share ÷ current share price × 100.
The annual dividend figure needs a label:
- Trailing yield uses dividends from the previous 12 months. Check whether the provider includes special dividends and which dates it uses to assign payments to that period.
- Annualized yield commonly multiplies the latest regular payment by the expected number of payments per year. Four times a quarterly dividend assumes that rate continues. It is an estimate, not a guaranteed payment schedule.
Show special dividends separately when assessing recurring income. A one-off payment can increase trailing yield without increasing the regular dividend, and should not automatically be repeated in an annualized figure.
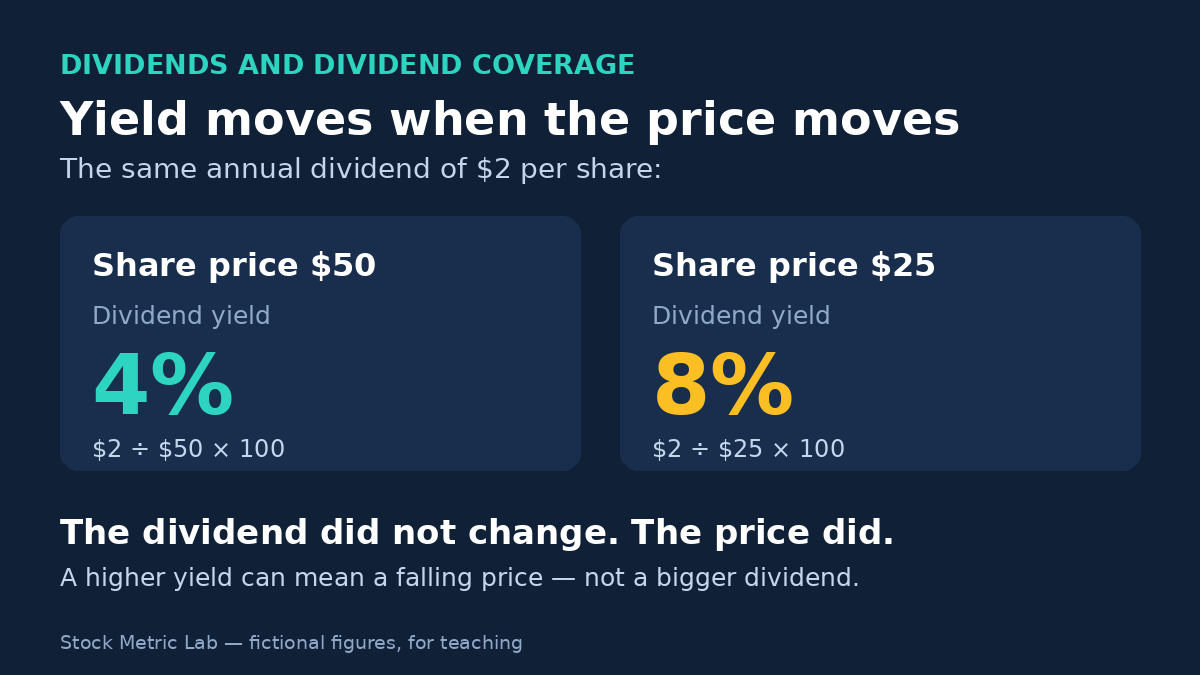
Consider a fictional stock with an unchanged annual dividend of $2 per share. At $50, its yield is 4%. If its price falls to $25, the yield becomes 8%. The dividend has not increased: the denominator has halved.
Dividend yield is not total return. Total return also reflects the change in the investment’s value. A dividend does not prevent a capital loss; stock prices can fall as well as rise. Investor.gov’s stocks guide describes these risks.
Compare dividends with earnings and cash flow
For this guide, the following ratios are explicitly defined analytical conventions. Check a data provider’s definitions before comparing its figures.
Earnings payout ratio = common dividends declared for the period ÷ net income available to common shareholders for that period × 100.
This compares distributions with accounting profit. It does not measure cash generation. The distinction matters because recorded earnings and cash receipts or payments can occur at different times. See free cash flow versus net income for more background.
For the cash calculation here, free cash flow (FCF) = cash flow from operating activities − cash capital expenditures. FCF is a non-GAAP measure with no uniform definition. Read the calculation and reconciliation to reported cash flow rather than relying on the label alone. SEC guidance, Question 102.07 explains these limitations. The free cash flow guide introduces the components.
Enter capex as a positive cash outflow so it is subtracted once. Using that definition:
- Historical FCF dividend coverage = FCF ÷ common cash dividends paid in the same period.
- FCF payout ratio = common cash dividends paid ÷ FCF × 100.
Coverage is expressed as a multiple; payout is a percentage. Both describe a historical relationship, not a forecast or a guarantee.
A fictional company example
Assume a fictional nonfinancial operating company with no preferred dividends or noncontrolling claims. All amounts are fictional, in US dollars, and cover the same completed financial year and reporting entity. Common dividends declared equal common cash dividends paid, with no timing difference.
| Item | Amount |
|---|---|
| Cash flow from operating activities | $150 million |
| Cash capital expenditures | $50 million |
| Free cash flow | $100 million |
| Common cash dividends paid and declared | $40 million |
| Net income available to common shareholders | $80 million |
The calculations are:
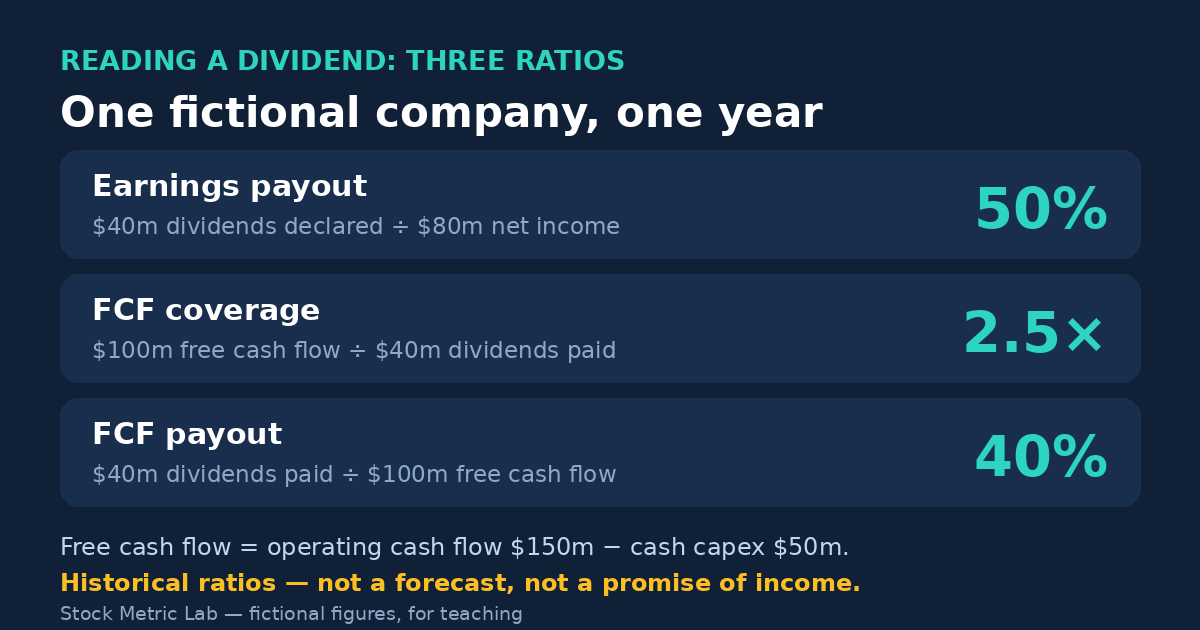
- Earnings payout: $40 million ÷ $80 million = 50%.
- Historical FCF dividend coverage: $100 million ÷ $40 million = 2.5 times.
- FCF payout: $40 million ÷ $100 million = 40%.
Here, historical FCF was 2.5 times common dividends paid. The remaining $60 million is not necessarily cash available for another distribution. Mandatory debt principal repayments and other obligations may not have been deducted from this FCF measure. SEC guidance, Question 102.07 cautions against treating all FCF as discretionary cash.
Check the inputs before drawing conclusions
Match the reporting period, currency, units, reporting entity, and share class. Do not divide quarterly dividends by annual earnings or mix a parent company’s distributions with an unrelated cash flow scope.
Keep declared and paid dividends distinct: a declaration and its cash payment can fall in different periods. Read the dividend disclosures and cash flow statement rather than assuming the amounts match as they do in the fictional example.
When earnings or FCF are zero, the corresponding payout percentage is undefined. When either is negative, a negative payout percentage is generally misleading as a measure of dividend affordability. If no common cash dividends were paid, the coverage multiple is undefined, not infinite. Examine the underlying amounts instead.
There is no universal safe cutoff. Business cycles, investment needs, debt obligations, and changes in cash generation all matter. Compare several periods and read the explanations behind large changes. The financial metrics overview provides context for interpreting these measures alongside other company information.
Before you quote a yield or a payout ratio
- Label the yield: trailing or annualized, and whether special dividends are inside it.
- Ask why the yield moved: a rising yield can mean a falling price, not a rising dividend.
- Check the payout basis: declared or paid, and the same period, currency and share class on both sides.
- Read coverage next to payout: the earnings ratio reads accounting profit; the FCF ratios read cash.
- If earnings or FCF are zero or negative, drop the percentage and read the underlying amounts.
- Separate historical ratios from annualized estimates; neither promises future income. There is no universal safe cutoff.
Educational content only, not a recommendation to buy, sell, or hold an investment. Investing involves risk, including possible loss of principal. The examples are hypothetical.