
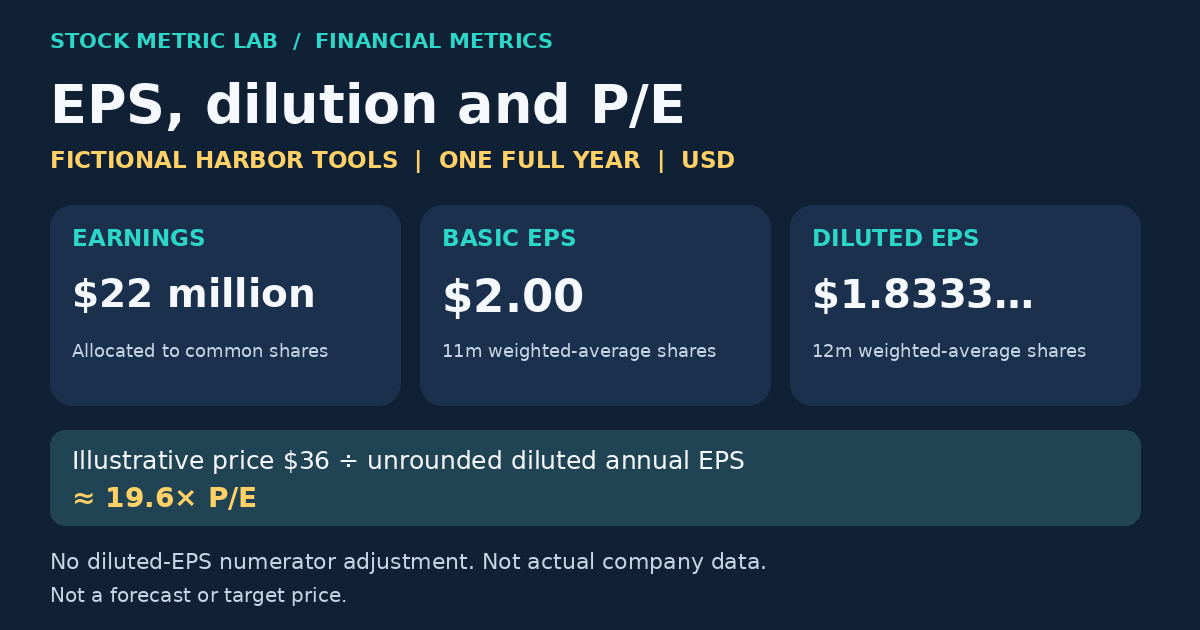
Earnings per share, or EPS, connects a company’s profit to its common shares. EPS can rise because profit increased, the share count fell, or both. To explain the change, examine the numerator and denominator separately.
Learn to trace earnings into basic and diluted EPS, then identify which earnings figure a price-to-earnings ratio uses. The accounting discussion focuses on U.S. generally accepted accounting principles (GAAP). If the statements are unfamiliar, begin with the three financial statements.
Start with earnings available to common shareholders
Basic EPS = Net income allocated to common shareholders for basic EPS ÷ Weighted-average common shares outstanding
The numerator is not automatically the first consolidated net-income figure you find. Income attributable to noncontrolling owners, preferred dividends, or allocations to other participating securities may affect the amount available to common shareholders. Use the EPS footnote’s reconciliation rather than making an unsupported subtraction. Citigroup’s 2025 Form 10-K, Note 11 illustrates why these allocations matter.
EPS measures accounting earnings per share, not a cash dividend or cash deposited in your account. Do not subtract common dividends: EPS measures earnings, not retained earnings. The business may retain profits, and profit differs from cash generated. The SEC’s financial-statement guide explains why the income statement and cash-flow statement must be read together.
Example 1 Harbor Tools and the weighted share count
Harbor Tools is fictional. All amounts are U.S. dollars, and the figures describe one complete calendar year. Assume each half receives exactly a 50% weight for this teaching example, with no stock split or other share changes.
| Input | Assumed amount |
|---|---|
| Net income available to common shareholders | $22 million |
| Common shares outstanding throughout the first half | 10 million |
| Common shares outstanding throughout the second half | 12 million |
| Incremental dilutive weighted shares in the EPS note | 1 million |
| Diluted EPS numerator adjustment | None |
Weighted-average basic shares = (10 million × 50%) + (12 million × 50%) = 11 million
Basic EPS = $22 million ÷ 11 million = $2.00
The 12 million year-end shares are a snapshot. They were not outstanding for the whole year. The weighted average matches the earnings period to the time shares were outstanding; actual filings use the applicable timing and accounting adjustments. When reconstructing EPS, do not substitute today’s share count or the balance-sheet date’s count.
Read the diluted EPS reconciliation
Diluted EPS incorporates qualifying potential common shares under accounting rules. Stock awards, options, and convertible securities can matter, but the denominator does not simply include every share that might ever exist. Microsoft’s 2025 annual report, Note 2, shows a basic-to-diluted share reconciliation and describes the treasury-stock method for its options and awards. That method measures an incremental effect, rather than adding every award one-for-one.
Options give holders the right to acquire shares; convertible securities can become shares under their terms. Identify the company’s instruments and follow its EPS note rather than building a fully diluted count from a list of awards.
For Harbor Tools, the EPS note has already calculated the incremental dilutive weighted shares:
Diluted weighted-average shares = 11 million + 1 million = 12 million
Diluted EPS = $22 million ÷ 12 million = $1.833333…
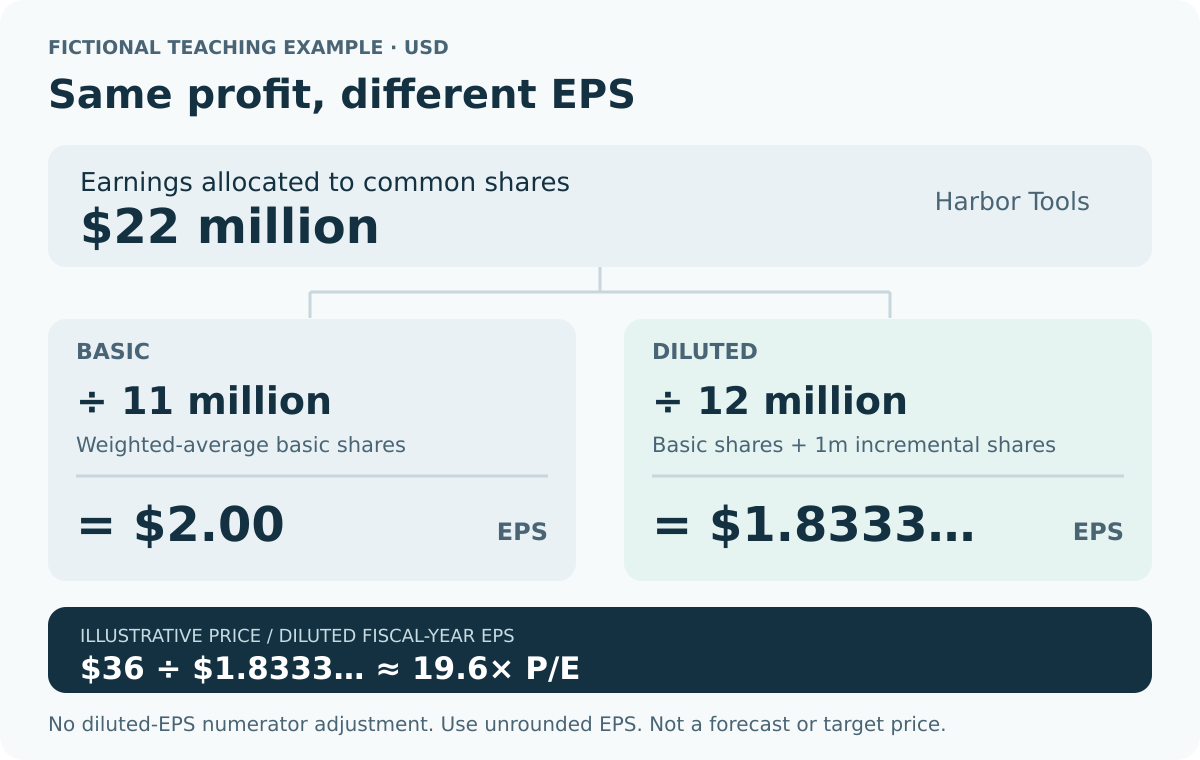
The diluted denominator happens to equal Harbor’s year-end share count. They remain different concepts. The example assumes no numerator adjustment; convertible instruments can require one, such as adding back relevant after-tax interest under assumed conversion. See the EPS reconciliation in Callaway’s 2025 Form 10-K.
Potential shares with an anti-dilutive effect are excluded. Broadly, including them would improve the controlling per-share result, such as making a loss appear smaller. Exclusion today does not eliminate future dilution risk. Under U.S. GAAP, income or loss from continuing operations available to common shareholders controls this test. A continuing-operations loss can exclude potential shares even when discontinued operations produce positive total net income, as Coherus’s 2025 Form 10-K illustrates. Do not assume diluted net EPS must always be lower than basic net EPS; read the reconciliation and any separately reported discontinued-operations amounts.
Example 2 Cedar Services and EPS growth without profit growth
Cedar Services is a separate fictional company. Compare two complete years on the same accounting basis. Assume no numerator adjustments and that repurchases have already been correctly reflected in the weighted-average diluted counts below.
| Measure | Prior year | Next year |
|---|---|---|
| Net income available to common shareholders | $20 million | $20 million |
| Weighted-average diluted shares | 10 million | 9 million |
| Diluted EPS | $2.00 | $2.222222… |
Next-year EPS = $20 million ÷ 9 million = $2.222222…
EPS growth = [($20 million ÷ 9 million) ÷ $2.00 − 1] × 100 = 11.1% rounded
Total earnings are flat; each weighted share is allocated more of them. This establishes per-share growth, not an improvement in sales, operating margins, or the underlying business. It also does not mean a 10% year-end buyback automatically reduces that year’s weighted denominator by 10%.
Repurchases consume cash and can change financial resilience, especially when financed with debt. New issuance may offset shares bought back. Investigate the cash spent, financing, repurchase prices, and net share movement before treating higher EPS as value creation. A buyback announcement alone does not explain the denominator.
Follow share-based compensation through the statements
Share-based compensation affects more than share count. Recognized compensation expense reduces accounting earnings. Under the indirect cash-flow method, its noncash component is added back in reconciling net income to operating cash flow. That add-back does not make employee compensation economically free.
Separately, awards can create dilution under EPS rules or lead to shares being issued. Examine compensation expense, the EPS share reconciliation, actual share issuance, and cash used for repurchases together. Apple’s 2025 Form 10-K, Notes 3, 10, and 11 and the cash-flow statement provides these disclosures, including repurchase cash outflows in financing activities. A company can spend heavily buying back shares while its net share reduction is much smaller.
Connect EPS to a clearly labelled P/E
P/E = Share price ÷ Selected annual earnings per share
Return to Harbor Tools. Assume an illustrative share price of $36, not a target price, and use its completed-year earnings:
Diluted trailing fiscal-year P/E = $36 ÷ ($22 million ÷ 12 million) = 19.63636… ≈ 19.6×
Basic trailing fiscal-year P/E = $36 ÷ $2.00 = 18.0×
Keep the unrounded EPS in the calculation, then round the final multiple. Dividing by a displayed EPS rounded to cents can give a slightly different result.
Record the price date and earnings period. A trailing P/E may use the latest completed fiscal year or trailing twelve months; those periods are not interchangeable. Do not multiply one seasonal quarter’s EPS by four and assume it represents a normal year. A forward P/E uses estimated earnings. Check whether the estimate covers the next fiscal year or next twelve months, and whether it is GAAP or adjusted.
When websites show different multiples, compare their dates, earnings periods, adjustments, and share definitions before deciding one is wrong.
Market capitalization divided by net income is not automatically identical to price divided by diluted EPS. Market capitalization commonly uses current outstanding shares; diluted EPS uses a weighted-average diluted denominator and may have numerator adjustments. Exact equivalence requires matching both share basis and earnings basis.
A P/E of 19.6× is neither a promised return nor a 19.6-year repayment clock. Earnings can change, and shareholders do not receive all reported earnings as cash. Business quality and investment attractiveness remain separate questions.
Check the earnings definition before comparing multiples
- Zero or negative earnings: P/E is undefined when EPS is zero. A negative P/E has no useful conventional interpretation as a cheapness ranking. Investigate the loss rather than treating a more negative ratio as a bargain.
- Unusual profits and cycles: an asset-sale gain, temporary tax benefit, or peak-cycle earnings can inflate EPS and make P/E look low. Ask how much earning power could persist.
- Adjusted EPS: treat it as a separate measure. Read the reconciliation to GAAP EPS, including tax effects; inspect excluded expenses and gains, and compare definitions across years and companies. A recurring cost does not disappear economically because management excludes it. The SEC’s non-GAAP guidance, Section 100 and Questions 102.05 and 102.11, explains reconciliation and misleading-presentation concerns.
- Stock splits: compare price and historical EPS on a consistent split-adjusted basis. A split alone does not change proportional ownership or make the business cheaper because the nominal share price falls. See the SEC’s explanation of stock splits.
Practice with one filing in five steps
- Label the period. Save the annual report and identify its fiscal-year end, currency, and units.
- Trace the numerator. Find earnings available to common shareholders and explain any difference from consolidated net income.
- Reconcile the denominator. Record basic and diluted weighted-average shares, numerator adjustments, and excluded potential shares. Recalculate both EPS figures.
- Explain the change. Compare earnings and share-count movements separately. Check compensation, issuance, repurchases, and unusual items.
- Label any P/E. Record price date, earnings period, basic or diluted basis, and GAAP or adjusted definition. Write one reason the multiple could mislead.
Write a short explanation of how earnings and weighted shares changed EPS. If you cannot explain a difference, return to the footnote.
You should finish with an explanation, not just a ratio. Next, compare what EV/EBITDA and P/E measure, or use the financial metrics guide to choose another question.
General education only, not personalized investment advice or a recommendation to buy or sell any security. Fictional examples demonstrate arithmetic, not forecasts.