
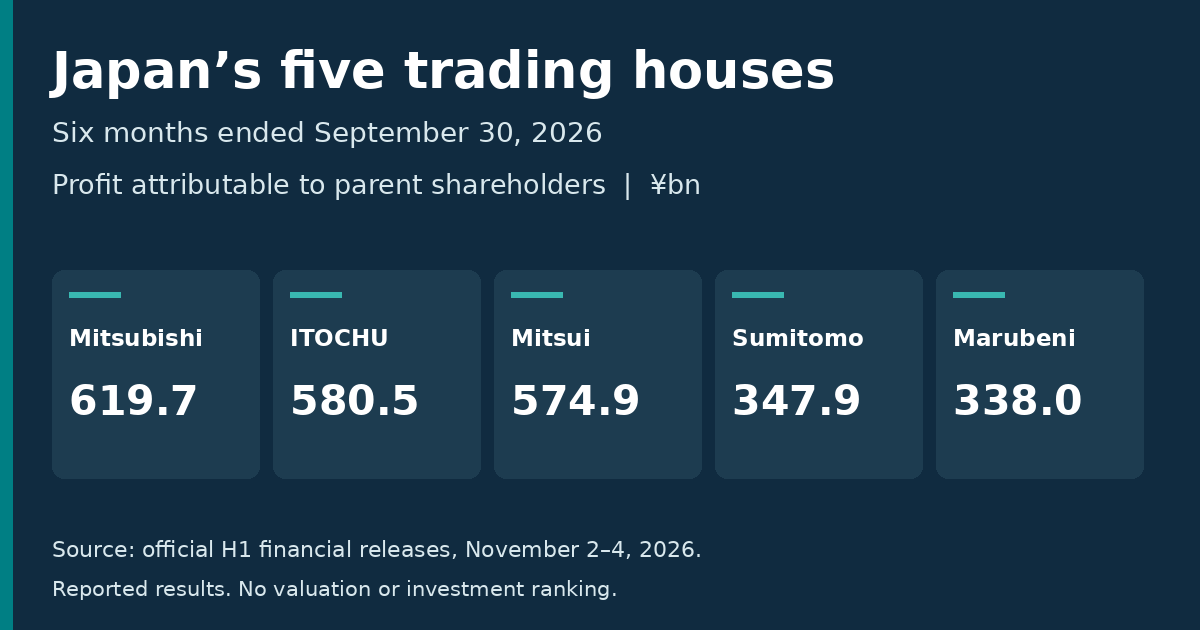
Japan’s five large trading houses all reported double-digit growth in profit attributable to their shareholders for the six months ended September 30, 2026. Four raised their full-year profit forecasts. Two raised their dividend forecasts at the half-year announcement, while three kept them unchanged.
The buyback picture is more varied than that split suggests. Mitsubishi announced a new ¥1 trillion authorization, but ITOCHU, Mitsui and Marubeni already had repurchase programs under way. Sumitomo had completed its ¥80 billion program in September. An unchanged dividend or profit forecast does not mean a company has stopped returning capital.
These companies report under IFRS for the same six-month period, which provides a useful starting point. Their business mixes, transactions, tax effects and company-defined performance measures still differ. This comparison separates reported results from management’s adjusted measures, and buyback authorizations from purchases actually reported.
The first-half scoreboard
All profit figures below are attributable to owners of the parent, including ITOCHU’s equivalent “net profit attributable to ITOCHU.” Full-year forecasts cover the year ending March 31, 2027. Amounts are in billions of yen.
| Company (Tokyo code) | H1 profit | Prior H1 profit | Year-over-year growth | Previous full-year forecast | Latest forecast | H1 / latest forecast |
|---|---|---|---|---|---|---|
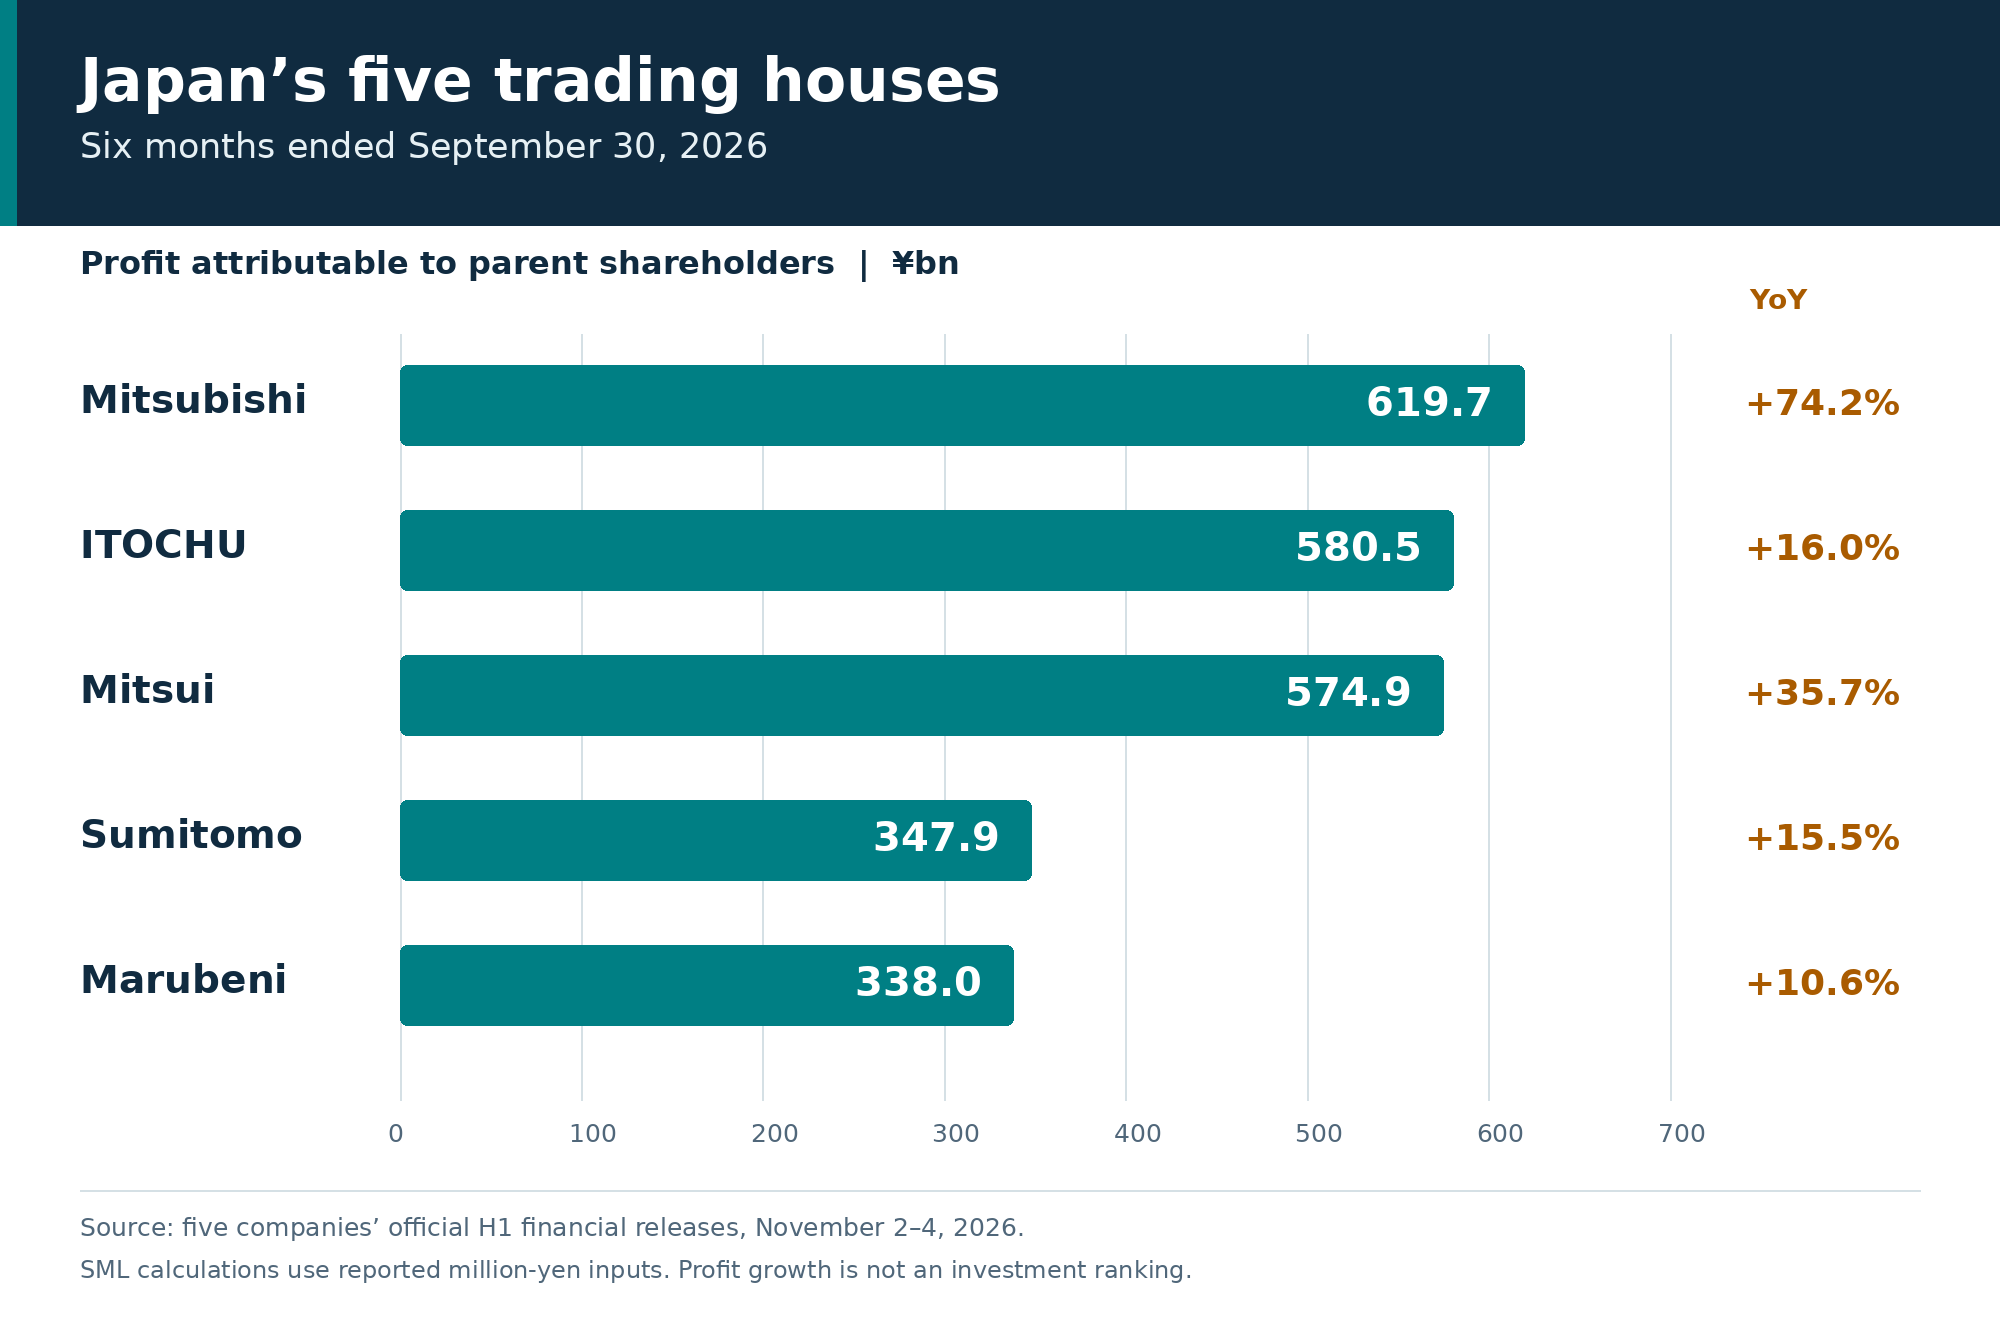
| Mitsubishi Corporation (8058) | 619.7 | 355.8 | +74.2% | 1,100 | 1,200 | 51.6% |
| ITOCHU Corporation (8001) | 580.5 | 500.3 | +16.0% | 950 | 950 | 61.1% |
| Mitsui & Co. (8031) | 574.9 | 423.7 | +35.7% | 920 | 1,050 | 54.7% |
| Sumitomo Corporation (8053) | 347.9 | 301.2 | +15.5% | 630 | 670 | 51.9% |
| Marubeni Corporation (8002) | 338.0 | 305.5 | +10.6% | 580 | 630 | 53.7% |
Sources: the Mitsubishi, ITOCHU, Mitsui, Sumitomo and Marubeni financial releases. Growth and forecast attainment are Stock Metric Lab calculations from the releases’ million-yen amounts, before rounding to billions for display. That is why Mitsui’s attainment is 54.7%, rather than the 54.8% obtained from the displayed ¥574.9 billion.
Mitsubishi had the largest reported profit and fastest profit growth in this group. Mitsui made the largest absolute forecast increase, adding ¥130 billion. ITOCHU had the highest attainment against its own forecast, at 61.1%, and was the only company to leave its profit forecast unchanged. Attainment is not a probability of beating guidance: seasonality, transaction timing, assumptions and the earnings mix can all affect the second half.
What changed at each company?
Mitsubishi: higher profit and a new repurchase authorization
Mitsubishi’s H1 profit rose to ¥619.7 billion from ¥355.8 billion. Its release identifies both business earnings and transaction-related effects, including stronger copper results, gains related to MC Healthcare and a Chiyoda revaluation. Reported profit growth should not be read as a uniform increase across all recurring operations.
The company raised its full-year profit forecast from ¥1.1 trillion to ¥1.2 trillion and its underlying operating cash flow forecast from ¥1.25 trillion to ¥1.38 trillion. It kept its annual dividend forecast at ¥125 per share, compared with the prior year’s ¥110.
The November 4 repurchase notice authorizes up to ¥1 trillion and up to 420 million shares from November 5, 2026 to July 31, 2027. All shares repurchased under that program are scheduled for cancellation on August 31, 2027. These are authorization limits and a planned cancellation, not completed purchases or cancellation.
The notice’s “about 6%” footnote refers to the hypothetical number of shares purchasable with ¥1 trillion at the November 2 closing price. It does not describe the 420 million-share cap.
ITOCHU: unchanged guidance, but an active ¥300 billion program
ITOCHU reported H1 profit of ¥580.5 billion, up 16.0%, and retained its ¥950 billion full-year forecast. Its results presentation also discloses core profit of ¥504.5 billion, versus ¥379.0 billion a year earlier. That is a company-defined earnings measure, not cash flow. It is not relabeled here as “basic profit.”
Tax effects were relevant at ITOCHU too. The release describes lower tax expense associated with Tokyo Century’s bond-type class shares and additional holdings in Hitachi Construction Machinery. A reported profit comparison needs to consider these effects alongside operating performance.
The annual dividend forecast remained ¥44 on the post-split basis. This was not the only unchanged dividend forecast: Mitsubishi and Mitsui also held theirs.
ITOCHU’s August 3 authorization covers up to ¥300 billion and 190 million shares through January 29, 2027. Its policy presentation describes repurchases of at least ¥300 billion for the fiscal year ending March 2027; the authorization itself has a ¥300 billion cap. The November 2 status notice reports ¥221.1 billion purchased through October 31, including the tender offer. “No new buyback announced with the earnings release” would therefore be a poor substitute for checking the existing program.
Mitsui: the largest profit forecast increase
Mitsui’s profit rose 35.7% to ¥574.9 billion. Its ¥130 billion forecast increase took full-year guidance to ¥1.05 trillion. The presentation’s segment bridge shows increases in Chemicals; Energy; Mobility, Digital & Infrastructure; Innovation & Corporate Development; and Mineral & Metal Resources.
Core operating cash flow reached ¥511.6 billion under Mitsui’s definition, and its full-year forecast for that measure rose from ¥1.05 trillion to ¥1.12 trillion. The annual dividend forecast stayed at ¥140, above the prior year’s ¥115.
Its August authorization allows up to ¥200 billion and 60 million shares. The November 2 update reports ¥85.0 billion executed through October 31. The repurchase period ends January 29, 2027; cancellation of all shares acquired under the program is scheduled for February 5, 2027.
Sumitomo: distinguish the tax bridge from the operating picture
Sumitomo’s parent-attributable profit rose ¥46.6 billion to ¥347.9 billion, although profit before tax fell ¥27.4 billion, or 7.4%. The income tax line improved by ¥56.8 billion, and profit attributable to non-controlling interests fell ¥17.2 billion. Both changes matter when reconciling the increase attributable to parent shareholders.
The Madagascar nickel exit illustrates why a tax benefit should not be discussed alone. Sumitomo’s updated presentation identifies an approximately ¥73 billion sale loss, ¥72 billion tax effect and ¥2 billion of external adviser fees and other costs: a net loss of approximately ¥3 billion for that exit, not a ¥72 billion net profit gain.
The same presentation reports underlying profit of approximately ¥334 billion, compared with ¥259 billion a year earlier. It also notes that asset-turnover gains and losses in domestic and overseas IPP/IWPP businesses are classified as underlying profit starting in this fiscal year. The metric should not be treated as a perfectly unchanged definition of recurring earnings.
Sumitomo raised its full-year profit forecast from ¥630 billion to ¥670 billion and its split-adjusted dividend forecast from ¥40 to ¥44. Its September 4 completion notice confirms that the ¥80 billion repurchase program finished on September 3. Cancellation of 47,653,100 repurchased shares is scheduled for April 9, 2027, rather than already completed.
Marubeni: disclosed drivers behind the upgrade
Marubeni’s H1 profit rose 10.6% to ¥338.0 billion. It increased its full-year profit forecast from ¥580 billion to ¥630 billion and its annual dividend forecast from ¥115 to ¥125.
The earnings release explicitly attributes the improved outlook to strong petrochemical product trading in Energy & Chemicals and Chilean copper operations in Metals. These are primary-source statements, not merely press commentary. Its presentation also reports approximately ¥318 billion of adjusted net profit, versus ¥220 billion, and defines that measure as net profit excluding one-time items.
The August repurchase program authorizes up to ¥100 billion and 40 million shares through March 31, 2027. The November 2 notice reports ¥32.6 billion executed through October 31.
There is a separate fiscal-year allocation of ¥145 billion: ¥45 billion announced in May plus ¥100 billion announced in August. The May amount was an expansion of an earlier program, whose entire ¥60 billion authorization was completed on June 23. Because that earlier program began in February, its full execution total crosses the fiscal-year boundary. Do not add these overlapping program and policy figures together.
Dividends and buybacks: compare decisions, not unlike totals
Dividend figures below are yen per ordinary share. The prior year ended March 31, 2026; the current forecast covers the year ending March 31, 2027.
| Company | Prior annual actual, comparable basis | Forecast before H1 results | Latest annual forecast | Action at H1 |
|---|---|---|---|---|
| Mitsubishi | 110 | 125 | 125 | Unchanged |
| ITOCHU | 42 | 44 | 44 | Unchanged |
| Mitsui | 115 | 140 | 140 | Unchanged |
| Sumitomo | 37.5 | 40 | 44 | Raised |
| Marubeni | 107.5 | 115 | 125 | Raised |
ITOCHU’s 5-for-1 split took effect on January 1, 2026. Its prior-year interim ¥100 becomes ¥20 on the current basis, which combines with the post-split final ¥22 to give ¥42. Sumitomo’s 4-for-1 split took effect on July 1, 2026, converting its prior annual ¥150 to ¥37.5. Each current forecast is above its own prior-year actual, but only two forecasts increased at these H1 announcements. These amounts are not dividend yields and do not rank income attractiveness across issuers.
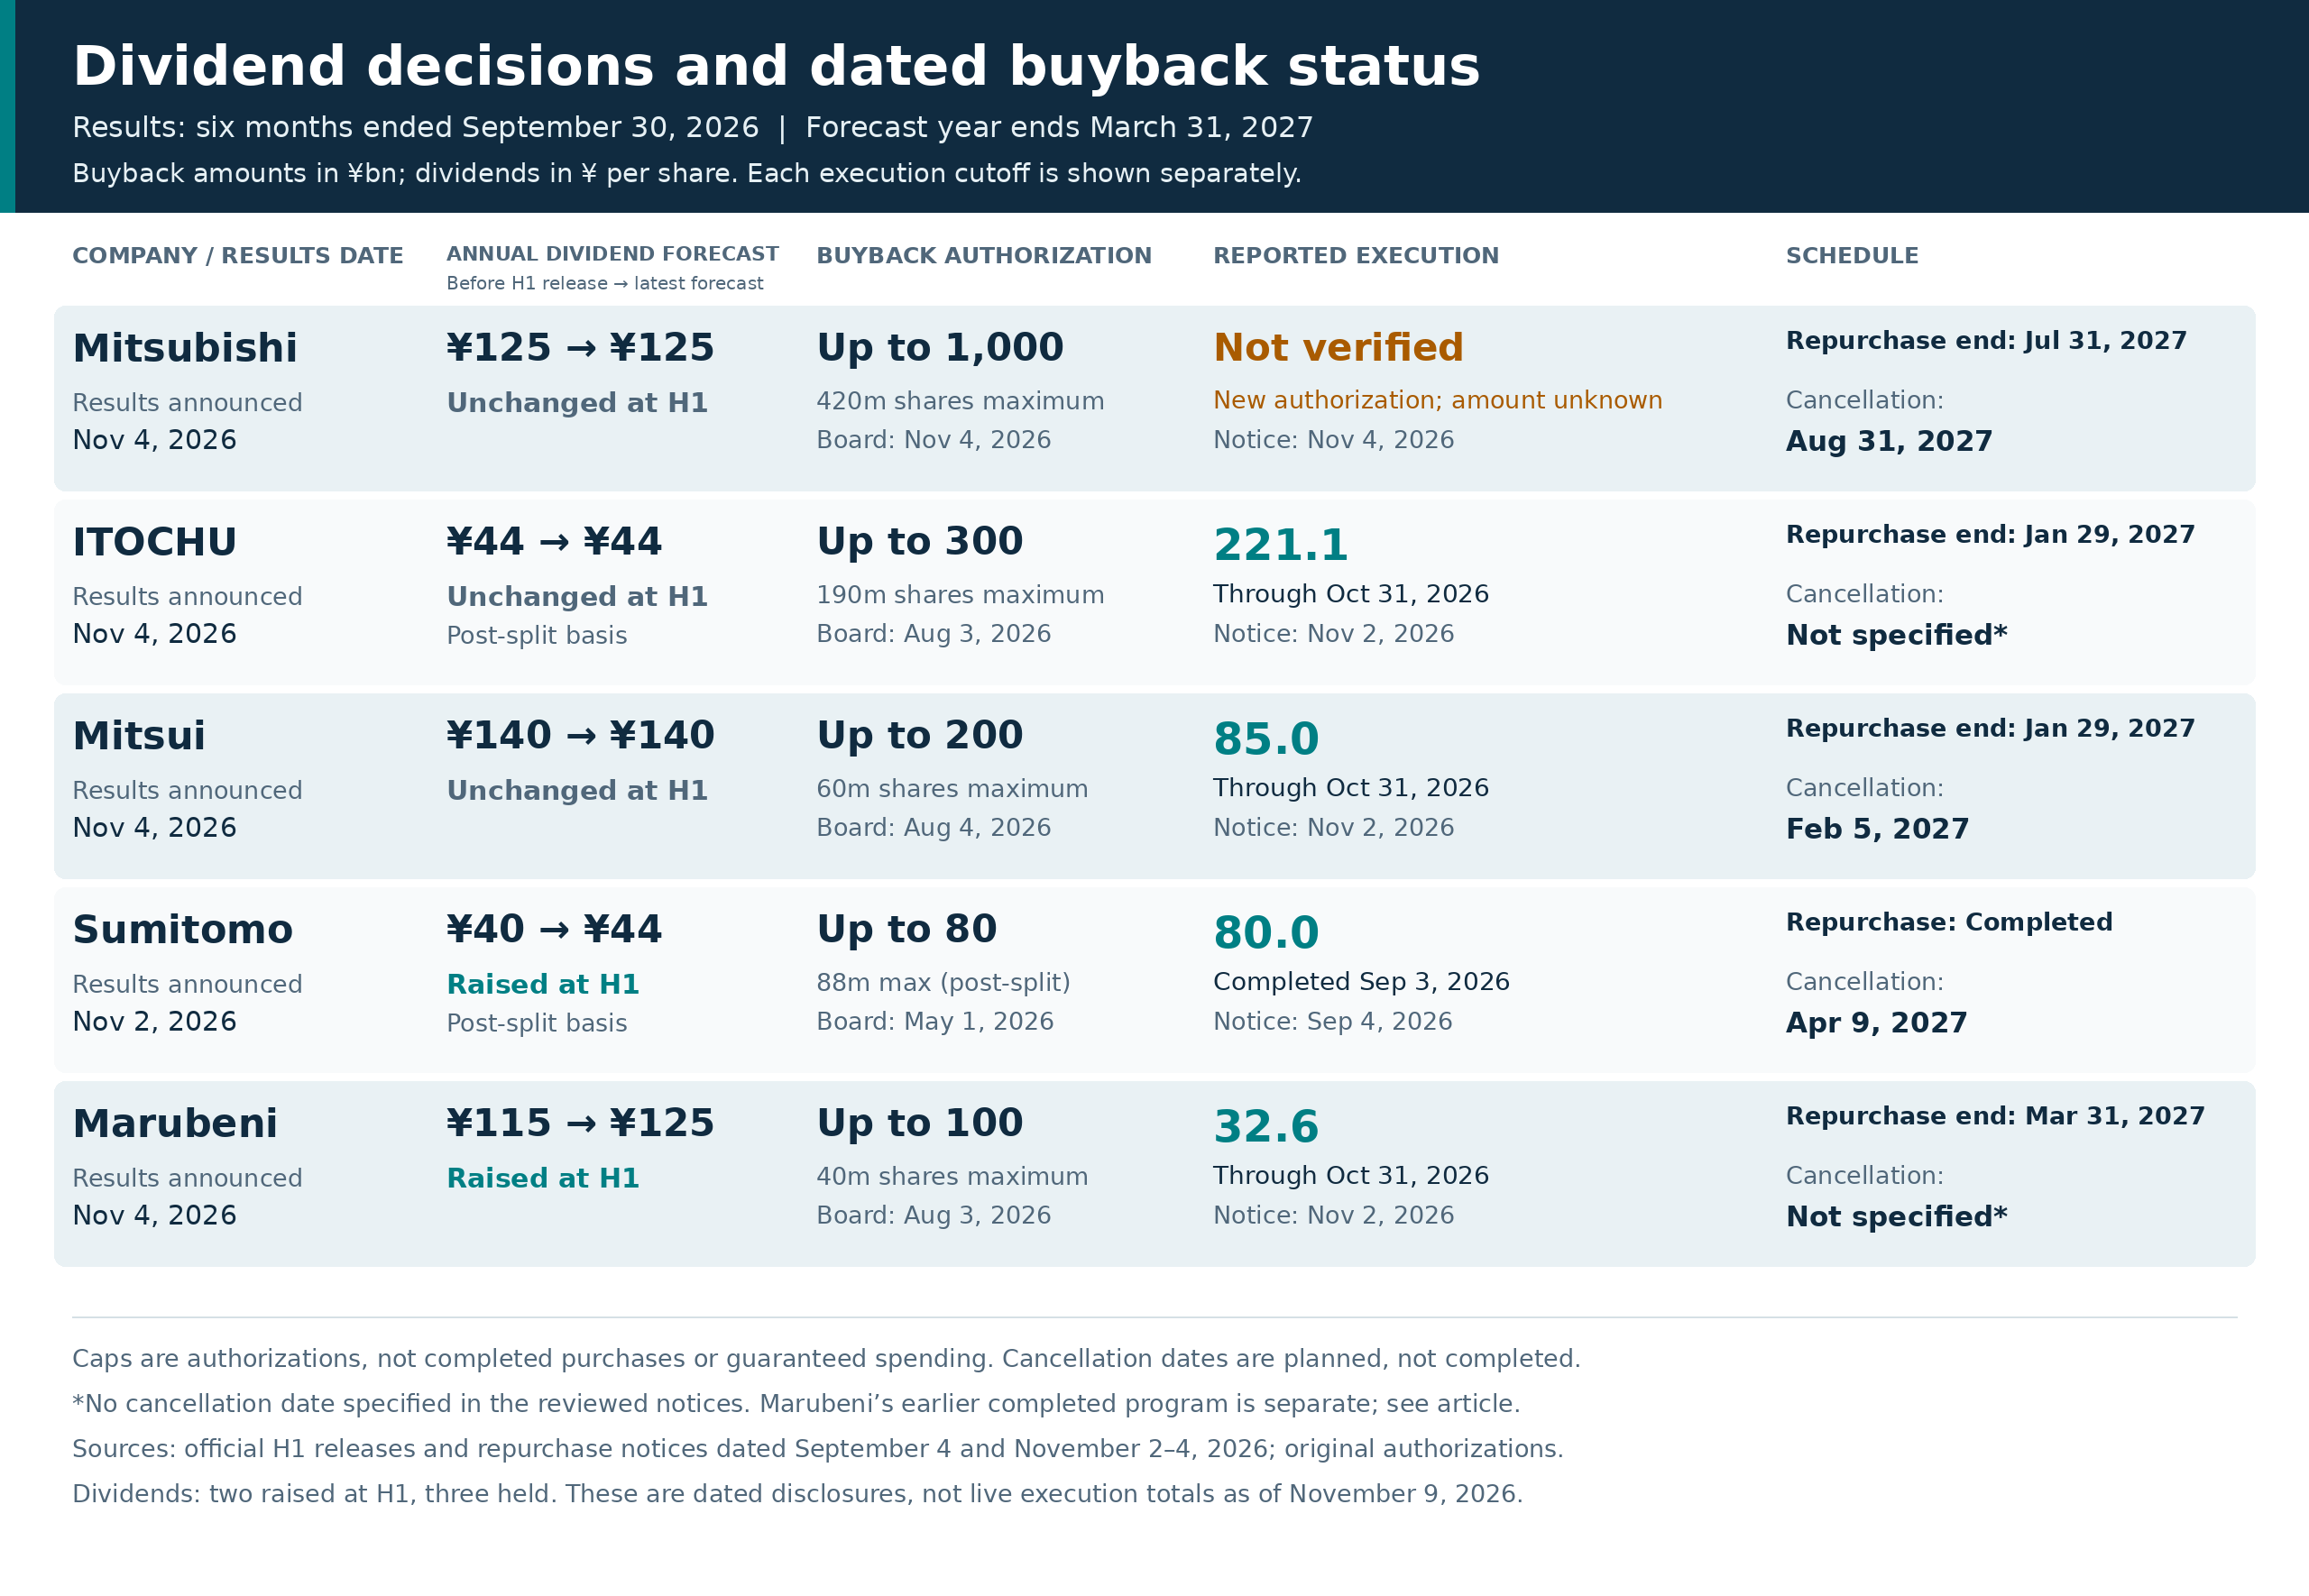
| Company | Program cap | Reported execution and cutoff | Repurchase deadline | Scheduled cancellation |
|---|---|---|---|---|
| Mitsubishi | ¥1,000bn; 420m shares | New November 4 authorization; execution not verified | July 31, 2027 | August 31, 2027 |
| ITOCHU | ¥300bn; 190m shares | ¥221.1bn through October 31, 2026 | January 29, 2027 | Not specified in the reviewed notices |
| Mitsui | ¥200bn; 60m shares | ¥85.0bn through October 31, 2026 | January 29, 2027 | February 5, 2027 |
| Sumitomo | ¥80bn; 88m shares, split-adjusted | ¥80.0bn; completed September 3, 2026 | Completed | April 9, 2027 |
| Marubeni | ¥100bn; 40m shares | ¥32.6bn through October 31, 2026 | March 31, 2027 | Not specified in the reviewed notices |
The table covers the identified programs, with Marubeni’s earlier completed program explained separately above. Both the yen and share caps apply. An authorization is not guaranteed spending. “Not specified” does not mean an issuer never cancels shares, and an unverified execution amount must not be assumed to be zero. The dated disclosures do not establish live execution totals as of November 9.
Cash flow: a common starting point, then company-specific definitions
The statements of cash flows provide reported operating and investing cash flows. Stock Metric Lab adds those two lines below to show a simple free-cash-flow measure. Each issuer also discusses this sum as free cash flow in its results materials; it is a derived measure, not an IFRS-required subtotal.
| Company | Operating cash flow | Investing cash flow | Operating + investing cash flow |
|---|---|---|---|
| Mitsubishi | 991.3 | −1,128.0 | −136.7 |
| ITOCHU | 293.2 | −152.1 | 141.1 |
| Mitsui | 223.4 | −200.0 | 23.4 |
| Sumitomo | 130.5 | −449.1 | −318.6 |
| Marubeni | 264.7 | −256.3 | 8.4 |
Amounts are billions of yen for the six months ended September 30, 2026, calculated from the reported million-yen lines before display rounding. Cash generation and investment are different questions. Acquisitions, disposals, capital spending and working-capital movements affect these totals, while tax, interest, dividend and lease classifications also need attention. For example, Sumitomo’s additional acquisition of SCSK shares from non-controlling shareholders is classified in financing activities, although it is included in the company’s broader investment-allocation discussion.
The five companies’ additional measures should be read separately:
- Mitsubishi: underlying operating cash flows, ¥728.1 billion. Operating cash flow excluding working-capital changes, but including ordinary-course lease-liability repayments as cash outflows. This is not a measure called “operating revenue cash flow.”
- ITOCHU: core operating cash flows, ¥475.0 billion. Its printed formula is operating cash flows minus changes in working capital plus “repayments of lease liabilities, etc.” Repayments are outflows, so the signed payment term must not be mistaken for a positive cash add-back. Core profit of ¥504.5 billion is a separate earnings measure.
- Mitsui: core operating cash flow, ¥511.6 billion. It removes the signed total of changes in operating assets and liabilities from operating cash flow and then deducts lease-liability repayments. The million-yen bridge is 223,401 − (−349,948) − 61,795 = 511,554.
- Sumitomo: cash flow earnings, ¥352.2 billion. This is an earnings-based construction using gross profit, expenses, net interest and dividends after an assumed tax rate, plus specified equity-method dividends, depreciation and signed lease-liability payments. It is not reported operating cash flow of ¥130.5 billion and should not be placed in a single “core operating cash flow” ranking with the other four.
- Marubeni: core operating cash flow, ¥387.2 billion. Its definition excludes “changes in working capital and others” from operating cash flow. The “and others” qualification matters. Adjusted net profit of approximately ¥318 billion is a separate earnings measure excluding one-time items.
The detailed definitions are in the linked releases and presentations. Rounded management measures may not reconcile exactly from rounded components. This article does not construct a cross-company ROIC ranking or rank these differently defined cash and earnings measures.
What the Berkshire connection does, and does not, establish
Berkshire’s 2024 annual report says it first purchased shares in the five companies in July 2019 and discusses their capital allocation and shareholder returns. Its 2025 annual report lists holdings in all five as of December 31, 2025.
That is useful historical context, not a valuation conclusion for November 2026. Berkshire’s comments about prices when it invested do not establish that today’s shares are cheap. This article uses no current market prices, valuation multiples or updated Berkshire ownership percentages and makes no individual buy or sell recommendation.
For the owner’s side of this relationship, our Berkshire Hathaway analysis explains how insurance, operating businesses and listed investments fit into its capital-allocation framework. Read the two analyses together to separate Berkshire’s investment rationale from each trading house’s own results and risks.
Reader checklist
- Start with the same reporting period and parent-attributable profit measure, then investigate the earnings mix.
- Distinguish a forecast increase at H1 from a forecast already above the prior year’s result.
- Adjust historical per-share dividends for splits before comparing them over time.
- Keep buyback authorization limits, execution cutoffs and scheduled cancellations separate.
- Read tax benefits together with associated losses and non-controlling interests.
- Check the definition before using an adjusted profit or cash-flow measure.
For a step-by-step approach to the underlying documents, see how to read an earnings report.
Frequently asked questions
Did all five raise their profit and dividend forecasts?
No. Mitsubishi, Mitsui, Sumitomo and Marubeni raised their full-year profit forecasts; ITOCHU held its forecast. Sumitomo and Marubeni raised their annual dividend forecasts at H1; the other three held theirs. All five annual dividend forecasts are above their own prior-year actuals on a comparable share basis.
Which company had the strongest first half?
Mitsubishi led this group on reported profit and year-over-year profit growth. ITOCHU had the highest attainment against its own annual profit forecast. Neither comparison, by itself, establishes the best investment or the strongest recurring operating performance.
Does an unchanged forecast mean there was no new capital return?
No. Forecast decisions and repurchase execution are separate. ITOCHU retained its profit and dividend forecasts while executing its August ¥300 billion repurchase authorization.
Are the five “core” measures directly comparable?
No single standardized measure is being quoted across all five. Some are adjusted cash-flow measures; others, including Sumitomo’s cash flow earnings and the companies’ adjusted profit figures, are earnings-based constructions. Use the reported statements and each company’s definition together.
Sources, dates and calculation notes
The reporting period is April 1–September 30, 2026, compared with April 1–September 30, 2025. Forecasts cover the year ending March 31, 2027. Some issuer materials call that fiscal year “FY2026”; their labels should not be confused with the calendar year or silently standardized as a bare “FY2027.”
Sumitomo announced results on November 2, 2026; the other four announced on November 4. The review also uses ITOCHU’s presentation currently linked from its official IR download page (retrieved November 15, 2026, JST) and Sumitomo’s presentation updated November 6. Repurchase execution uses the dates explicitly shown in the table, not the H1 reporting date or the article’s review date. Sources were checked on November 9, 2026, JST.
Primary financial releases and presentations are linked where used above. Additional return-policy support includes Mitsui’s August 4 authorization, Sumitomo’s November 2 forecast and dividend revision, Marubeni’s August 3 authorization, May 1 amendment and November 4 dividend revision.
Year-over-year growth is current H1 profit divided by prior H1 profit, minus one. Forecast attainment is H1 profit divided by the latest full-year forecast. Calculations use the releases’ million-yen amounts before display rounding; the source amounts may themselves be rounded or truncated below ¥1 million. Forecasts, planned repurchases and scheduled cancellations remain subject to change.