
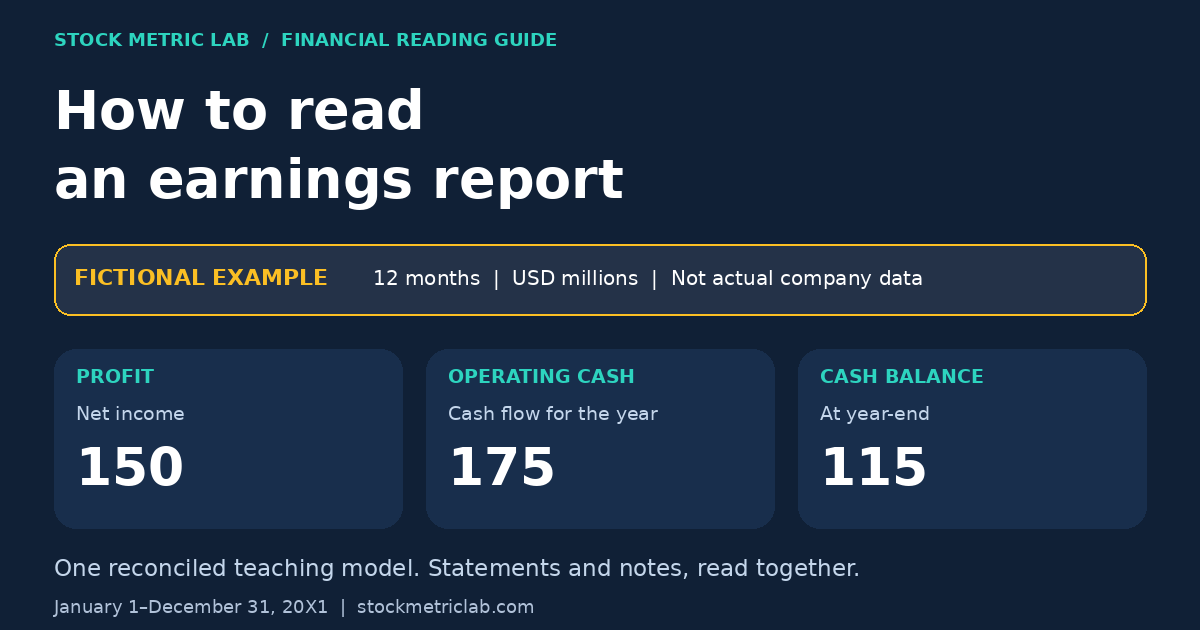
An earnings report usually comes as a package: a release, financial statements and notes, and often a presentation or earnings call. The pieces answer different questions. A useful reading method keeps their periods, definitions and reporting scope aligned.
This guide works through one fictional company whose figures reconcile across an income statement, balance sheet and cash-flow statement. The example is deliberately simple. Its purpose is to make the connections visible before you encounter the complications in a real filing.
The focus is the reading workflow and one complete numerical reconciliation: profit, both balance sheets, all three cash-flow sections and closing cash. For a first introduction, see the three financial statements. The companion guides cover free cash flow versus net income and calculating trailing-12-month free cash flow in more detail.
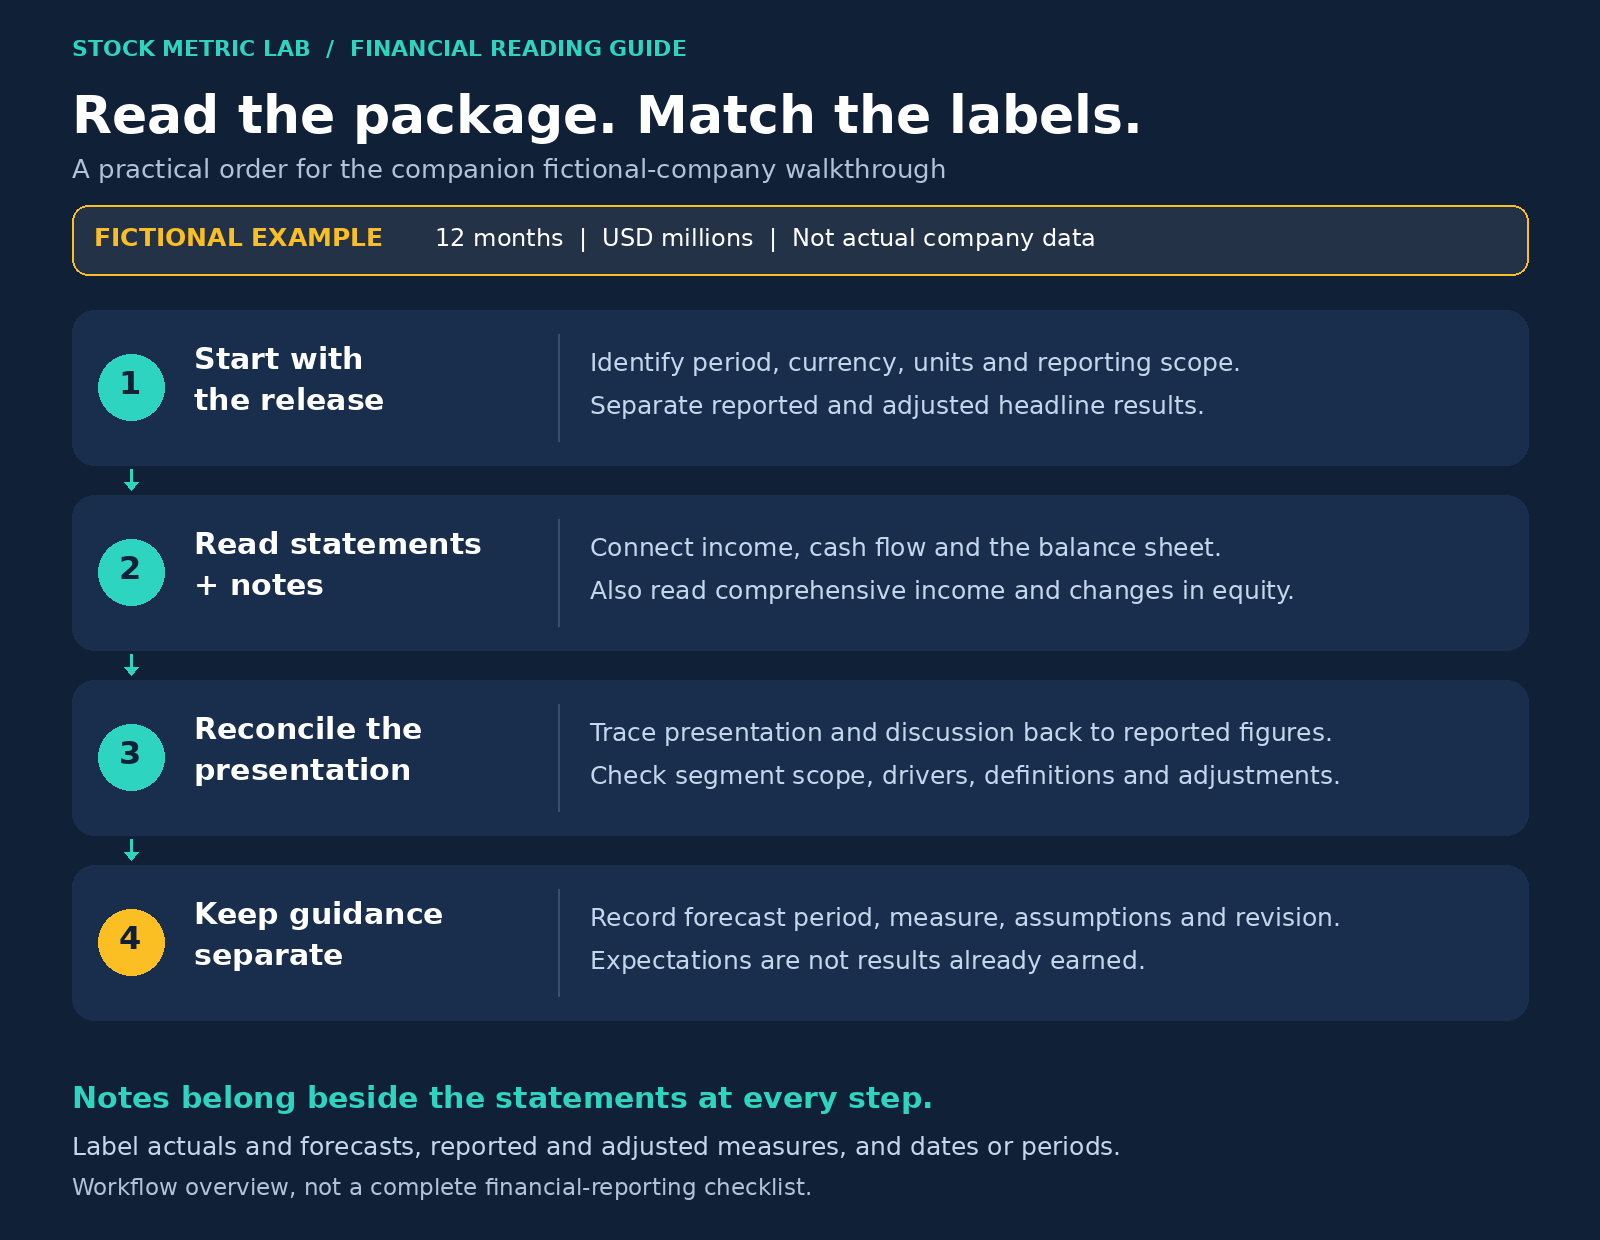
1. The Package, and the Order to Read It In
Start with four parts of the package:
- The earnings release. Identify the period, headline results and any guidance revision. This is management’s selection of highlights.
- The financial statements and their notes. Read the income statement, balance sheet and cash-flow statement together. A full annual set also includes information about comprehensive income and changes in equity, plus the notes. The notes belong beside the statements, not at the end of the reading queue. See the IFRS Foundation’s summary of a complete set of financial statements.
- The presentation and management discussion. Use them for segment performance, business drivers and explanations. Check how their measures connect to the reported financial statements.
- Guidance. Record the forecast period, measure, assumptions and changes from the previous forecast separately from results already reported.
For a 15-minute first pass, read the release headlines, income statement, available cash-flow summary, key notes and guidance, using section 10’s checklist. For a deeper review, follow each important change into the relevant statement or note.
Label each figure with its period or balance-sheet date, currency and units, reporting scope such as consolidated or segment, and basis such as reported or adjusted. Distinguish actual results from forecasts. An unusual item can be part of an actual result, so “one-off” is an additional description, not a separate kind of reporting period.
2. The Income Statement: Five Figures to Track
Meet Example Corp, a fictional goods reseller. All amounts are exact US$ millions, except per-share amounts. Income and cash flows cover the same 12-month fiscal year, January 1 to December 31, 20X1. The balance sheets show the beginning and end of that year.
The example’s simplifying assumptions
- The balance-sheet lines below are the company’s entire assets, liabilities and equity. There are no omitted balances, subsidiaries, non-controlling interests, preferred shares or discontinued operations.
- Revenue is billed credit sales to customers. Receivables contain only those trade balances. There are no customer advances, deferred revenue, contract assets, sales taxes in the balances, returns, discounts, bad debts, allowance movements, receivables sales or factoring.
- Inventory is purchased merchandise, and payables relate only to those purchases. There are no inventory write-downs, non-cash purchases or other working-capital balances. All operating expenses other than depreciation are paid in cash during the year.
- Depreciation of 60 is included entirely in operating expenses. All PP&E additions are the 90 of capital expenditure paid in cash. There are no disposals, impairments, revaluations, leases, business acquisitions, foreign-exchange effects or other non-cash movements.
- Interest expense of 20 and tax expense of 50 are also the year’s cash payments. There are no interest or tax receivables/payables, deferred taxes or capitalized interest. Interest and income taxes are classified as operating cash flows; dividends paid are financing cash flows, consistent with the simplified US-GAAP-style presentation used here.
- Debt changes only through a cash principal repayment of 20. Dividends of 30 are declared and paid during the year. There are no other equity movements, other comprehensive income, share-based compensation, share issues, buybacks or restatements. All net income belongs to ordinary shareholders.
- There are 100 million ordinary shares outstanding throughout the year, so the weighted-average share count is also 100 million. There are no potentially dilutive securities. “Cash” has the same scope in both statements, with no cash equivalents, restricted-cash balances or overdrafts.
These assumptions make the short bridges below exact. They are not facts to assume about a real company.
| Income statement: year ended December 31, 20X1 | US$M |
|---|---|
| Revenue | 1,200 |
| Cost of goods sold | (720) |
| Gross profit | 480 |
| Operating expenses, including depreciation of 60 | (260) |
| Operating income | 220 |
| Interest expense | (20) |
| Income before taxes | 200 |
| Income tax expense | (50) |
| Net income | 150 |
The five figures to track first are revenue, gross profit, operating income, net income and the effective tax rate. Here:
- Gross margin = 480 ÷ 1,200 = 40%.
- Operating margin = 220 ÷ 1,200 = 18.3%, rounded to one decimal place.
- Effective tax rate = 50 ÷ 200 = 25%.
Margins help explain how revenue becomes profit. Compare them with the company’s own history and comparable businesses before drawing a conclusion about quality. Different business models and accounting presentations can produce very different margins.
Depreciation allocates the cost of plant and equipment over its useful life. It reduces profit here without being a current-period cash payment. Section 5 shows why it is added back when reconciling net income to operating cash flow.
The income statement alone does not tell you how much customers paid or how much cash the company generated.
3. Revenue Is Not Cash: The Receivables Bridge
Example Corp recognized revenue of 1,200. Its receivables increased by 30. Under the assumptions above, cash collected from customers was therefore 1,170.
| Balance sheet | January 1, 20X1 | December 31, 20X1 | Change |
|---|---|---|---|
| Cash | 80 | 115 | +35 |
| Trade accounts receivable | 100 | 130 | +30 |
| Inventories | 90 | 110 | +20 |
| Property, plant and equipment, net | 400 | 430 | +30 |
| Total assets | 670 | 785 | +115 |
| Trade accounts payable | 70 | 85 | +15 |
| Debt | 200 | 180 | −20 |
| Total liabilities | 270 | 265 | −5 |
| Shareholders’ equity | 400 | 520 | +120 |
| Total liabilities and equity | 670 | 785 | +115 |
All amounts are US$M. The totals are subtotals of the lines above, not additional balances.
For this example, the bridge is:
Opening receivables 100 + revenue 1,200 − cash collected 1,170 = closing receivables 130.
Equivalently:
Cash collected = revenue 1,200 − increase in receivables 30 = 1,170.
Collections include cash relating to opening receivables as well as current-year sales. They measure money received, not the amount still financed for customers. Closing receivables are the amount still outstanding at year-end.
Revenue is not universally recorded at delivery. Under IFRS 15, it is recognized as the relevant performance obligation is satisfied through transfer of control, either at a point in time or over time. Cash can arrive before, at or after that point. See the IFRS Foundation’s revenue-recognition overview.
In real accounts, advance payments, contract assets, taxes, bad debts, acquisitions, currency movements and other adjustments can break the simple revenue-minus-receivables formula. Read the revenue and receivables notes before using it.
Receivables rising faster than sales over comparable periods merit investigation. Possible explanations include seasonality, changed payment terms, slower collections or the timing of sales. The increase alone does not prove growth or improper revenue recognition. Example Corp has no prior-year revenue figure, so we cannot infer revenue growth from this example.
4. The Balance Sheet: Reconcile the Movements
At each date, assets = liabilities + equity. Example Corp balances at 670 at the start of the year and 785 at the end.
Two short bridges work here:
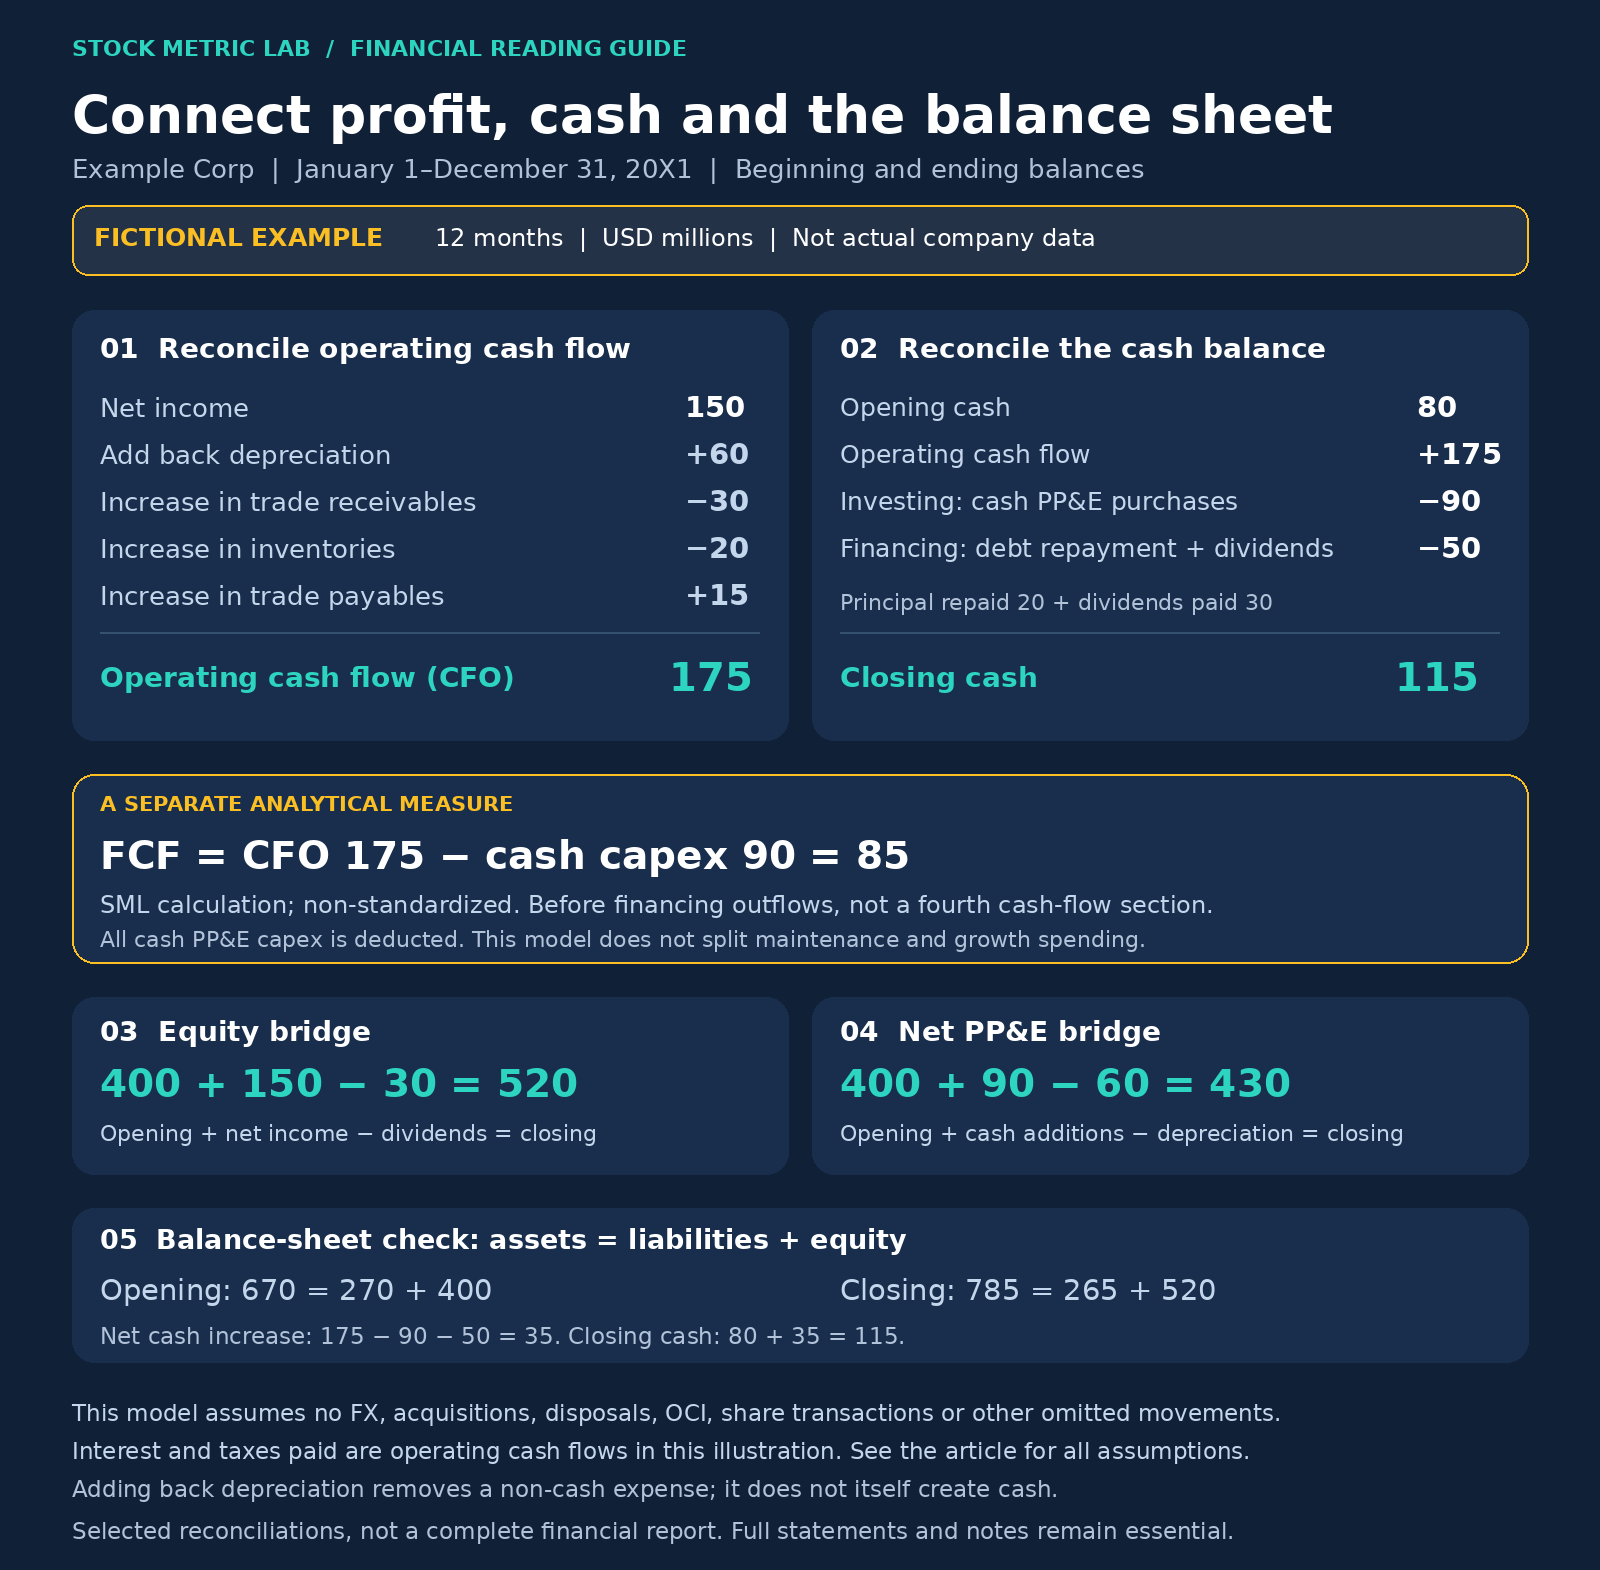
- Equity: opening equity 400 + net income 150 − dividends 30 = closing equity 520.
- Net PP&E: opening PP&E 400 + cash additions 90 − depreciation 60 = closing PP&E 430.
A real company’s balance-sheet changes do not all pass through its income statement or its cash-flow statement. Other comprehensive income, non-cash asset purchases, revaluations, share transactions and changes in the reporting group may require separate explanations. Use the statement of changes in equity and the relevant notes as well as the other statements. Non-cash investing and financing transactions are excluded from cash flows and disclosed separately under IAS 7.
When a bridge does not reconcile, first check the period, reporting scope, currency, units and rounding. Then look for the missing movement. A difference is a reason to investigate, not automatic evidence that the accounts are wrong.
5. The Cash-Flow Statement: Rebuilding Profit Into Cash
Example Corp uses an indirect reconciliation starting with net income. It adds back the non-cash depreciation expense and adjusts for the operating balances that changed during the year:
| Operating cash-flow reconciliation: year ended December 31, 20X1 | US$M |
|---|---|
| Net income | 150 |
| Add: depreciation | +60 |
| Less: increase in trade receivables | −30 |
| Less: increase in inventories | −20 |
| Add: increase in trade payables | +15 |
| Net cash from operating activities (CFO) | 175 |
Depreciation does not generate cash. Adding it back removes a non-cash expense already deducted in arriving at net income. The working-capital adjustments account for differences between recognized income/expenses and cash receipts/payments under this example’s assumptions.
The three cash-flow sections then reconcile to cash:
| Cash-flow summary: year ended December 31, 20X1 | US$M |
|---|---|
| Net cash from operating activities | +175 |
| Net cash used in investing activities: cash PP&E purchases | −90 |
| Net cash used in financing activities: debt principal repayment 20 and dividends 30 | −50 |
| Net increase in cash | +35 |
| Opening cash | 80 |
| Closing cash | 115 |
As an independent check, merchandise purchases are 720 + 20 = 740; cash paid to suppliers is 740 − 15 = 725. Customer receipts of 1,170, less supplier payments of 725, cash operating expenses of 200, interest paid of 20 and tax paid of 50, also give CFO of 175.
For analysis, we calculate a separate measure:
Free cash flow (FCF), defined here as CFO minus cash capital expenditure = 175 − 90 = 85.
The entire 90 of capex is deducted, whether it maintains existing capacity or expands it. This example does not separate maintenance from growth capex, so it cannot tell you the split or whether maintenance needs have been fully funded. The 85 is before the debt repayment and dividends; after those 50 of financing outflows, cash increases by 35.
FCF is not an additional cash-flow category to add into the cash reconciliation. It has no single universal definition and is not a required subtotal of the financial statements. It also need not be freely available to distribute. The SEC’s guidance on free cash flow, Question 102.07, stresses its definition, reconciliation and limitations. For the broader framework, see free cash flow, explained.
With the assumed constant 100 million ordinary shares, basic EPS is $1.50 (150 ÷ 100). The year’s dividends paid are $0.30 per share (30 ÷ 100), and the net-income payout ratio is 20% (30 ÷ 150). Real EPS uses the appropriate earnings numerator and weighted-average shares, not automatically the year-end share count; diluted EPS can differ. See IAS 33 and the dividend guide.
Cash-flow presentations differ. Some use the direct method; indirect presentations do not universally start from net income. Check the starting line and the classification of interest and dividends before comparing companies. The IFRS transition noted under Sources and Method is particularly relevant from 2027.
6. The Period Trap: Cumulative Cash Flow vs Quarterly Profit
A common error is comparing cash flow for six or nine months with profit for just three months. Japanese earnings materials often discuss a standalone quarter while reporting financial figures for the cumulative fiscal period. Always read the dates on each statement.
Use these checks:
- Match the months. Compare six-month CFO with six-month profit, or three-month CFO with three-month profit.
- Derive a standalone quarter only when both cumulative figures are available and comparable. For a company with an April-to-March fiscal year, July–September CFO = April–September CFO − April–June CFO. Label the result “derived.”
- Check the basis before subtracting. Use matching currencies, units, line definitions and reporting scope. Use restated comparative figures where applicable. A change in accounting basis or reporting perimeter may prevent a meaningful like-for-like comparison.
- Do not fill a missing quarter with an estimate labeled as reported data. If the necessary cash-flow statement is absent, use the available half-year or full-year figures and say that standalone quarterly CFO is unavailable.
Under Japan’s current post-2024 quarterly-disclosure framework, first- and third-quarter earnings reports may omit a cash-flow statement. A cash-flow-related note does not necessarily provide enough detail to reconstruct CFO. See TSE’s current preparation guidance, pages 63–65.
The subtraction method applies to additive flow amounts, such as revenue or CFO. Do not use it to derive quarterly margins, EPS or weighted-average share counts by simply subtracting the cumulative ratios. Balance sheets are snapshots, not cumulative flows.
7. Profit vs Cash: A Question, Not a Verdict
“CFO above net income is healthy; below is a warning” is too simple. Start by explaining the difference:
- Receivables and inventory. Growth can require cash before it produces collections, but rising operating assets can also reflect slower collection or unsold stock. Example Corp’s additional receivables and inventory absorb 50, partly offset by a 15 increase in supplier credit.
- Depreciation. A large add-back can put CFO well above net income. It does not eliminate the cost of replacing assets, and depreciation need not equal the cash required for replacement.
- Payment timing. Taxes, restructuring payments and other accrued costs can affect cash in a different period from the expense. An item that occurs irregularly is not automatically non-recurring.
- Share-based compensation. A non-cash equity-settled expense can be added back in an indirect CFO reconciliation. It remains an economic cost and can dilute shareholders. Cash-settled awards and tax-withholding settlements can involve cash payments; buybacks used to offset dilution also consume cash. Check the award terms, share counts and financing flows. IFRS 2 covers both equity- and cash-settled arrangements.
Content, product development and other business spending may be expensed or capitalized depending on the activity and applicable accounting rules. Do not assume that spending described as “investment” belongs in investing cash flow, or that it is unusual.
Ask which lines explain the gap, whether those movements are sustainable, and how they compare with similar periods. An explained working-capital movement can still signal a business problem. If the reconciliation is unavailable or incomplete, record that limitation rather than inventing a favorable explanation.
8. Debt: Coverage, Maturity and Terms
A leverage ratio needs business context. A stable business and a cyclical business at peak earnings can face very different risks at the same multiple.
Start with three questions:
- Coverage. How does profit compare with interest expense? Here, operating income ÷ interest expense = 220 ÷ 20 = 11 times. This is an accrual-based interest-coverage measure. It is not proof that cash is available when payments fall due. Interest paid happens to equal interest expense in this example; in real accounts, check actual cash interest separately and do not substitute an unlabeled CFO ratio.
- Maturity and liquidity. When must principal be repaid or refinanced? Compare maturities and other commitments with unrestricted cash, credible cash-generation expectations and available committed facilities. Refinancing is not assured.
- Terms. Read fixed versus floating rates, security, covenants and restrictions. Both the amount borrowed and its conditions matter.
Example Corp repaid 20 of debt and paid 30 in dividends while increasing cash by 35. That describes this year’s cash allocation. It does not, by itself, establish that the remaining 180 of debt is safe or that the dividend is sustainable.
9. Actuals, Forecasts and Adjustments: Label Everything
Keep the following distinctions clear:
- Actual results describe a period that has occurred. They may be preliminary, unaudited, reviewed or audited, depending on the document and jurisdiction. Check the status and any later correction. For example, US Form 10-K annual statements are audited, while Form 10-Q statements are unaudited. Unaudited statements can still have undergone a review. An audit or review does not make estimates certain. See the SEC’s guide to EDGAR filings.
- Forecasts describe management’s expectations for a future period, not a promise. A forecast revision changes expectations; it is not a result already earned. Note the forecast’s date, period, measure, assumptions and risks.
- Unusual items may affect reported results: an asset-sale gain, impairment, refund or restructuring charge, for example. Identify the item, its amount, its tax effect where relevant and its cash timing. Do not automatically remove it from a future run-rate just because management calls it “one-off.” Check whether similar items recur.
Adjusted or company-defined measures can help explain management’s view, but read their definitions and reconcile the adjustments to the most directly comparable reported measure. Check consistency across periods and whether gains and losses receive comparable treatment. The SEC’s non-GAAP guidance explains why some exclusions or labels can mislead. If an adjusted forecast cannot be fully reconciled from the available information, record the gap.
Reported and adjusted results answer different questions. Neither should silently replace the other. For the return-on-capital framework used after this first review, see ROIC, explained.
10. The 15-Minute Checklist
- Labels: period or date, currency, units, consolidated or segment scope, actual or forecast, reported or adjusted.
- Income statement: revenue, gross margin, operating margin, net income and effective tax rate. What changed, and why?
- Receivables and inventory: compare movements with the business’s sales pattern, payment terms and seasonality. Do not infer growth from a balance alone.
- CFO bridge: explain material non-cash items and working-capital movements. Identify missing information.
- Period check: match the months in the cash and profit figures. Derive a quarter only from comparable available cumulative amounts.
- FCF: state the formula and capex scope. Here it is CFO minus all cash PP&E purchases; do not assume a maintenance/growth split.
- Balance-sheet reconciliation: use the statement of changes in equity and notes, including non-cash and comprehensive-income movements. Match the cash-flow reconciliation’s cash definition and include any exchange-rate effects.
- Debt: check interest expense and cash interest separately, plus maturities, liquidity and covenants.
- Unusual items and adjustments: identify amounts, cash timing, recurrence and reconciliation to reported results.
- Guidance: record what management expects, for which period, under which assumptions, and what changed.
For how a drawdown affects portfolio value, see the companion guide to drawdown and recovery math.
Frequently Asked Questions
Where do I find the statements rather than a news summary?
Start with the company’s investor-relations site and the full earnings release with its attachments. Then check the applicable annual or interim regulatory filing and any amendments. US filings are available through SEC EDGAR. A release may precede a fuller filing; not every reporting period or jurisdiction has the same package. If a headline measure appears only in a presentation, look for its definition and reconciliation before using it.
The presentation’s profit differs from the release’s. Which is right?
First check period, currency, units, consolidation scope and definition. One may be adjusted, segment-based or attributable to a different group of owners. The difference may be legitimate, but do not assume both are correct. Reconcile them, check for later corrections and leave the discrepancy unresolved if the documents do not explain it.
Is negative operating cash flow a sign of trouble?
It can be, but one period is not enough to decide. Identify whether the cause is operating losses, working-capital movements, payment timing or another item. Then examine liquidity, funding, commitments and the pattern over comparable periods. A plausible growth explanation does not remove financing risk.
Can I always derive a Japanese company’s standalone quarterly cash flow?
No. You need compatible cumulative cash-flow figures for both endpoints. Japanese first- and third-quarter earnings reports may omit the cash-flow statement. When the required figure is missing, compare the available half-year or full-year periods instead and state the limitation.
Sources and Method
The worked example is fictional. It is a teaching model, not a complete standards-compliant financial report or a template for any real company’s results. Its income statement and cash flows cover one 12-month period; its balance sheets are measured at that period’s two endpoints. The stated assumptions make both balance sheets balance and reconcile net income, operating cash flow, PP&E, equity, debt and cash. Percentages are rounded only where indicated.
The numerical cash-flow presentation is US-GAAP-style: interest paid and income taxes paid are operating flows, and dividends paid are financing flows. See the cash-flow illustrations in FASB ASU 2016-18. Real classifications and required disclosures depend on the applicable standards and facts. The guide draws on official SEC, IFRS Foundation and TSE sources linked at the relevant points. It does not treat the three systems as interchangeable.
IFRS timing note: IFRS 18 replaces IAS 1 for annual reporting periods beginning on or after January 1, 2027, with earlier application permitted. Its amendments to IAS 7 require operating profit or loss as the indirect-method starting point and change requirements for interest and dividend cash-flow classification. Check the company’s adoption status before comparing periods or companies.
Japanese quarterly-disclosure references were checked against TSE’s July 2026 guidance. TSE’s September 2024 disclosure survey also documents cash-flow-statement omissions following the quarterly-disclosure reform. Source review completed November 8, 2026 UTC.
This guide is for general financial education, not a recommendation to buy or sell a security.