
A profit margin measures how much accounting profit a company earns for each dollar of revenue. Gross, operating and net margins use different profit figures, so each answers a different question. This guide explains the formulas, works through an example, and shows how to avoid misleading comparisons.
Margin (%) = the specified profit figure ÷ revenue × 100. Use the same reporting period, currency units and business scope for both inputs. A quarterly profit divided by annual revenue is not a quarterly margin.
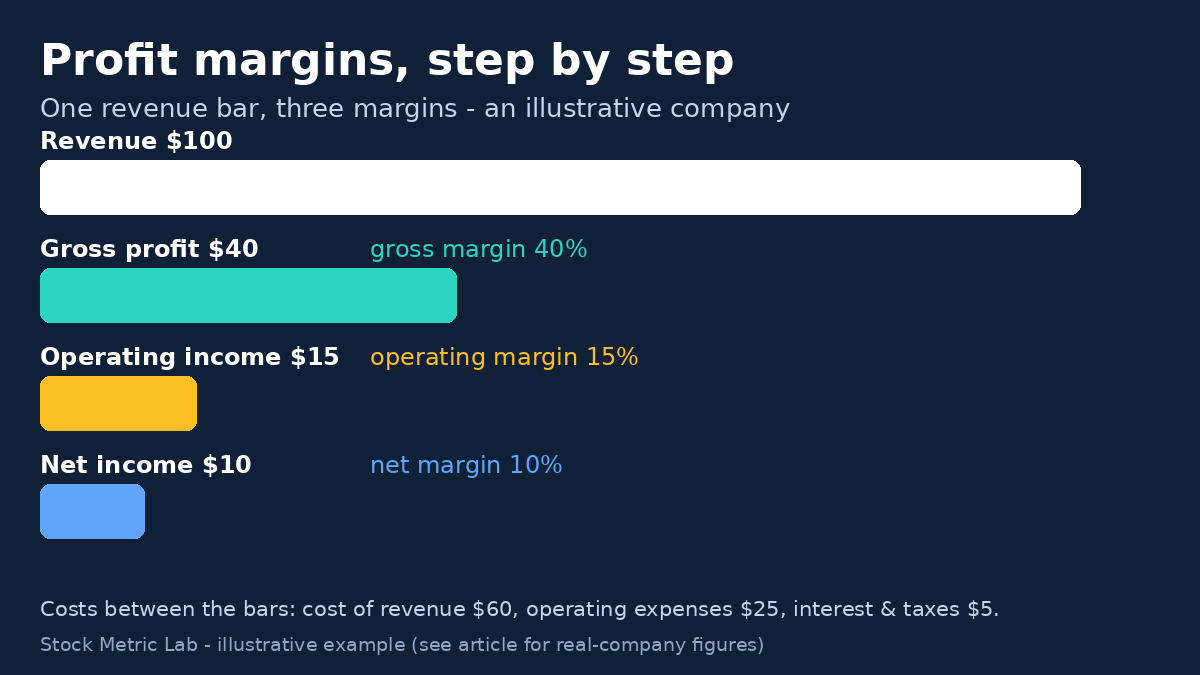
Illustrative figures, not a real company. The deductions are $60 of cost of revenue, $25 of other operating expenses, and $5 of interest and income taxes, with no other income or expenses.
The three profit margins
Gross margin
Gross margin (%) = gross profit ÷ revenue × 100.
Gross profit is revenue minus cost of sales, also called cost of revenue. It helps explain how selling prices, sales mix and the costs recorded in that line affect profitability.
Cost of sales is not limited to direct materials or labor. It can include allocated production overhead and depreciation. For example, IAS 2 includes production overhead in inventory conversion costs. Check the company’s accounting policy before assuming gross margin is measured before all overhead. Businesses can also classify similar costs differently.
Operating margin
Operating margin (%) = operating income ÷ revenue × 100.
For a typical non-financial business, operating income includes the costs of running the operation, such as research and development, sales and administration, before financing items and income taxes. Depending on the presentation, operating income may also include other operating gains or charges. Use the company’s reported subtotal and notes rather than assuming every income statement follows the same layout.
Net margin
Net margin (%) = net income ÷ revenue × 100.
Net income includes the effects of financing, income taxes and other income or expenses. Investment gains, legal charges and tax changes can therefore move net margin even when sales economics have not changed much.
Specify which net-income line you use. Consolidated net income includes profit belonging to noncontrolling interests; net income attributable to the parent’s shareholders excludes that share. Both ratios appear in analysis, but switching between them can create an artificial change. Keep the choice consistent and label it.
The SEC’s financial-statement guide explains the income-statement sequence. Our three financial statements guide connects those profit figures to the balance sheet and cash flow.
A simple example
Suppose a fictional company records the following amounts in one period:
- Revenue: $100.
- Cost of revenue: $60, leaving $40 of gross profit and a 40% gross margin.
- Other operating expenses: $25, leaving $15 of operating income and a 15% operating margin.
- Interest and income taxes: $5 in total, leaving $10 of net income and a 10% net margin.
This example assumes no other gains, losses or noncontrolling interests. Actual statements need not form a steadily descending staircase: other income or a tax benefit can increase profit at a later stage.
Arm shows why the profit line matters
The following examples use dated company disclosures checked on November 9, 2026. They teach how to read margins, rather than rank companies in different industries.
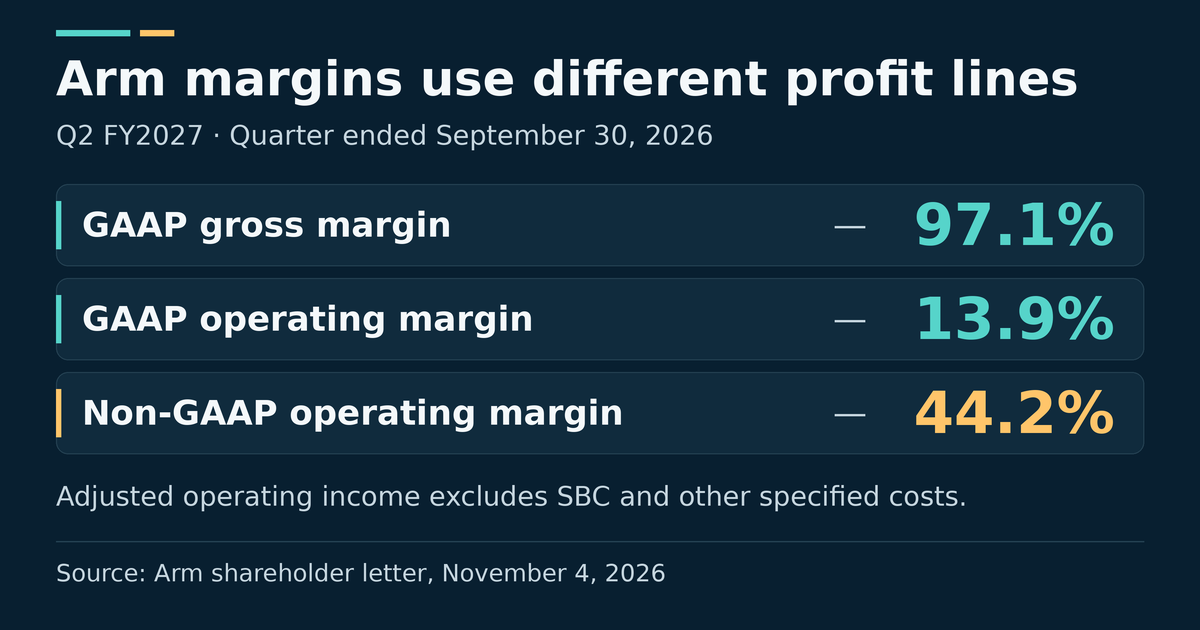
For Arm’s Q2 FY2027, the quarter ended September 30, 2026, revenue was $1,443 million. GAAP gross profit of $1,401 million produced a 97.1% gross margin. After operating expenses, GAAP operating income was $201 million, a 13.9% operating margin. GAAP net income was $130 million, giving a 9.0% net margin, calculated here from the reported figures. See Arm’s shareholder letter and financial statements.
Arm also reported non-GAAP operating income of $638 million and a 44.2% non-GAAP operating margin. Its reconciliation adds back $377 million of equity-settled share-based compensation, $48 million of related employer taxes net of R&D tax incentives, and $12 million of acquisition-related expenses: $201 million + $377 million + $48 million + $12 million = $638 million.
A very high gross margin can therefore coexist with much lower operating and net margins. Adjusted results supplement the GAAP figures; they do not erase the economic cost of compensation or acquisitions. The Arm analysis provides more business context.
Coca-Cola shows why the business model matters
For Coca-Cola’s Q3 2026, the quarter ended October 2, 2026, reported operating income of $4,465 million divided by net operating revenues of $13,380 million gives 33.4%, rounded to one decimal place. The inputs are in its Form 10-Q income statement. The company’s earnings release also reports a 33.4% GAAP operating margin and a different, 32.9% comparable non-GAAP operating margin.
Coca-Cola includes both concentrate operations and finished-product operations. Its consolidated accounts are not the accounts of every independent bottler in the Coca-Cola system. The Coca-Cola analysis explains that structure.
These periods end close together, but Coca-Cola and Arm are not direct peers. Comparing the two GAAP operating margins illustrates different cost structures, not which business is better. Comparing Coca-Cola’s GAAP margin with Arm’s adjusted margin would introduce another difference in accounting basis.
Four checks before comparing margins
1. Match the business and the denominator. Start with the same company over time, then peers with similar operations. Check whether revenue is reported gross or as a net fee. For example, IFRS 15 distinguishes a principal’s gross revenue from an agent’s fee or commission, as set out in paragraphs B35B–B36 of the standard published by New Zealand’s External Reporting Board. This is an accounting assessment, not a free choice. Different denominators can produce very different margins. Gross margin is also less useful for businesses such as banks whose statements are organized differently.
2. Match the profit definition. Compare GAAP with GAAP, or reconcile adjusted figures to a common basis. Company-defined adjustments are not universal. Operating income, EBIT and EBITDA are also not interchangeable: EBIT starts from net income before interest and taxes, while EBITDA additionally excludes depreciation and amortization. Non-operating items can make EBIT differ from operating income. The SEC’s guidance, questions 103.01–103.02, explains this distinction.
3. Identify large charges without dismissing them. Meta’s Q3 2026, ended September 30, had $64.601 billion of revenue and $12.988 billion of operating income. Its reported operating margin was 20%, rounded to a whole percent. Operating expenses included a $9.89 billion legal charge related to the August agreement with U.S. state attorneys general. Meta said excluding the charge would increase operating income to about $22.88 billion. That is supplemental context, not the GAAP result or proof that legal costs can be ignored. See Meta’s filed earnings release and our Meta analysis. A charge recognized in one quarter does not establish that similar costs will never recur.
4. Check cash flow and the period. Accounting profit is not cash received. Receivables, inventory, payment timing and non-cash expenses can explain differences between profit and operating cash flow. Compare matching periods: a quarterly income statement should not be paired uncritically with a nine-month cash-flow figure. Review several periods, and consider free cash flow and return on invested capital alongside margins. For input-cost exposure, use the oil prices and company margins checklist.
A short checklist
- Name the margin, profit line and accounting basis.
- Match the period, units, revenue definition and business scope.
- Compare the company’s history and suitable peers, allowing for seasonal effects.
- Trace changes to disclosed causes such as prices, product mix, input costs, currency or a named charge.
- Reconcile adjusted figures and review cash flow before drawing a conclusion.
A margin is one part of the stock analysis framework, not a complete investment case.
Frequently asked questions
What is a good gross margin?
There is no universal threshold. Compare businesses with similar revenue models, cost classifications and capital needs. A higher percentage alone does not establish stronger cash generation or a more attractive investment.
Can a margin exceed 100% or go negative?
Yes. With positive revenue, nonnegative costs and no additional gains, gross and operating margins do not exceed 100%. But those conditions do not always hold. Where accounting rules permit, expense reversals can reduce reported costs, and other operating gains can lift operating income. For example, IAS 2, paragraphs 33–34, permits qualifying inventory write-down reversals and records them as a reduction in inventory expense. This does not mean all accounting frameworks allow the same treatment. Large non-operating gains can also push net margin above 100%.
With positive revenue, a loss produces a negative margin. At zero revenue the ratio is undefined; with negative revenue it is usually not meaningful as an ordinary profitability measure. Investigate unusual results rather than assuming an error.
Why can profit rise while the margin falls?
Revenue may grow faster than profit. For an illustrative company, operating profit rising from $10 to $12 while revenue rises from $100 to $150 means profit increases 20%, but operating margin falls from 10% to 8%. The margin fell 2 percentage points, not 2%.
Is profit margin the same as markup?
No. Margin divides profit by revenue; markup divides it by the relevant cost. If an item sells for $100 and costs $60, its $40 gross profit represents a 40% gross margin and a 66.7% markup on cost. These are illustrative figures, before other business expenses.
This article is for educational and informational purposes only. It is not investment, financial, tax, legal, or accounting advice, and it is not a recommendation to buy, sell, or hold any security. Verify current filings and figures before making an investment decision.