
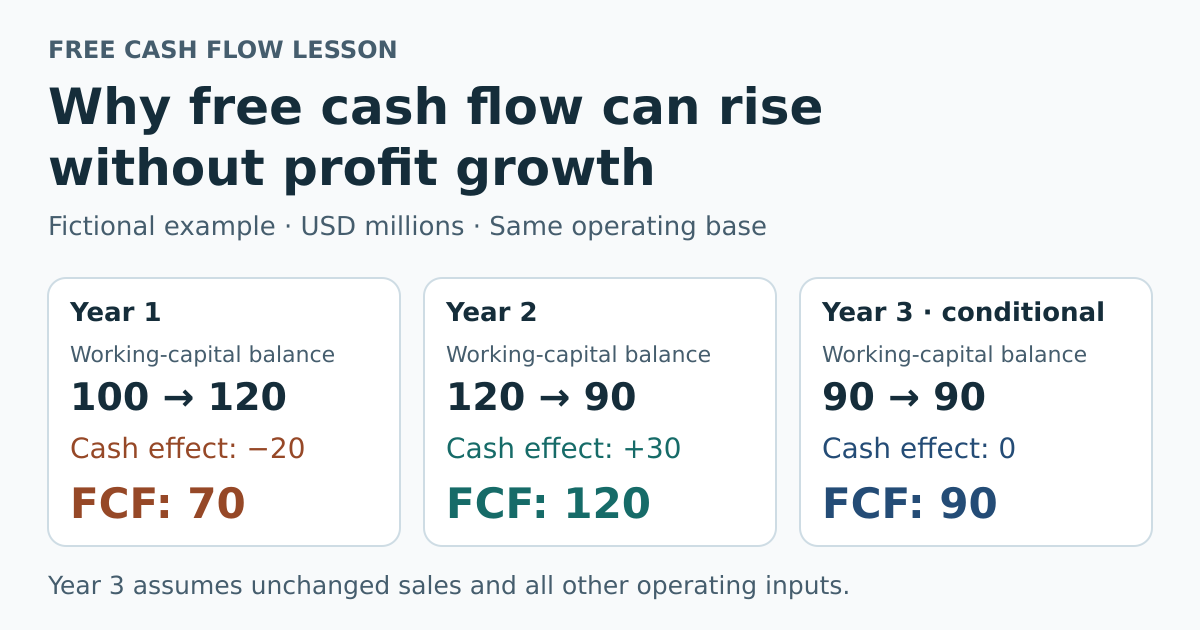
Free cash flow can rise sharply even when operating profit stays flat. A business may collect outstanding customer bills, reduce inventory, or use more supplier credit. Those movements change how much cash is tied up in daily operations.
The important forecasting question is whether another cash release will happen next year. A business can keep working capital at a lower level without releasing the same amount again. This fictional example follows the balances across several years, then shows how that distinction changes a cash flow yield and a valuation scenario.
Separate the balance from the change
Here, operating net working capital means receivables plus inventory minus ordinary trade payables. Receivables are unpaid customer bills; payables are unpaid supplier bills. Cash and interest-bearing debt stay separate. Real companies can have other operating balances, so this is a simplified definition, rather than total current assets minus total current liabilities. NYU Stern explains the operating working capital distinction.
A balance is measured on a date. Its change is measured over a period:
Change in working capital = ending balance − opening balance.
Under the simplified assumptions below, an increase absorbs cash and a decrease releases cash. The indirect cash flow statement reconciles net income to operating cash flow by adjusting for noncash items and operating assets and liabilities. See the SEC guide to financial statements.
Follow two years with unchanged profit
Here, free cash flow means operating cash flow minus capital expenditures. The SEC’s guidance in Question 102.07 notes that FCF has no uniform definition and may omit mandatory cash uses. Keep the formula beside the number.
Every numerical example in this lesson is fictional. Monetary amounts are USD millions unless stated per share; share counts are millions of shares. Years 1, 2, and 3 are consecutive full years. Each year opens at the previous year’s closing balance. In Years 1 and 2, revenue is 1,000, operating profit before interest and tax is 125, and operating taxes are 25 at a 20% rate. After-tax operating profit and net income are both 100. Depreciation and amortization are 20; cash capital expenditures are 30. Capex is a positive spending amount when subtracted from operating cash flow.
Assume no debt, interest, net borrowing, stock-based compensation, leases, acquisitions, disposals, foreign-exchange effects, tax-timing differences, or other adjustments. Cash taxes equal the operating tax charge. Working capital changes only through the operating cash movements shown.
| Balance | Opening Year 1 | End Year 1 | End Year 2 |
|---|---|---|---|
| Receivables | 40 | 50 | 40 |
| Inventory | 80 | 100 | 80 |
| Trade payables | 20 | 30 | 30 |
| Net working capital | 100 | 120 | 90 |
Year 1 needs 20 more working capital: 120 − 100. Year 2 releases 30: its ending balance of 90 is 30 below its opening balance of 120.
| Calculation | Year 1 | Year 2 |
|---|---|---|
| Net income | 100 | 100 |
| Depreciation and amortization add-back | +20 | +20 |
| Working capital cash effect: minus the change | −20 | +30 |
| Operating cash flow | 100 | 150 |
| Cash capital expenditures: outflow | −30 | −30 |
| Free cash flow | 70 | 120 |
Year 2 free cash flow is 100 + 20 − (−30) − 30 = 120. It rises by 50, or 71.4%, from Year 1. The whole improvement comes from switching from a 20 cash absorption to a 30 cash release. Operating profit has not grown.
If starting with operating cash flow, simply subtract capital expenditures here. Operating cash flow already includes depreciation and working capital effects. Adding depreciation again or subtracting the working capital change again would double count them.
Only this deliberately debt-free, adjustment-free example makes operating cash flow minus capex equal both free cash flow to the firm, or FCFF, and free cash flow to equity, or FCFE. They are not generally interchangeable. NYU Stern distinguishes their formulas; SML’s reported cash flow to DCF walkthrough explains the reconciliation.
A lower balance does not repeat the release
Suppose Year 3 has the same sales, profit, depreciation, and capex, while working capital stays at 90. Its change is zero. Operating cash flow is 120 and free cash flow is 90, not 120.

If working capital instead returns from 90 to 120, the 30 investment reduces Year 3 free cash flow to 60. Neither scenario is a prediction. They show why forecasting the next balance is more useful than repeating last year’s cash effect.
A lower balance can reflect lasting efficiency. Nevertheless, a positive working capital base cannot release the same cash indefinitely. Forecast needs should reflect sales and operating conditions, as discussed in NYU Stern’s working capital guidance. Do not automatically add back every investment that supports growth.
For example, 90 working capital on 1,000 sales is 9%. If sales rise to 1,100 and that ratio stays constant, required working capital becomes 99. The business needs 9 of additional investment despite keeping the improved ratio. The 9% ratio is an assumption for this example, not a universal target. This calculation isolates working capital; it does not forecast the profit or capex needed for that sales growth.
Check what caused the movement
More payables can mean agreed supplier credit or difficulty paying bills. Less inventory can mean efficiency, stockouts, or a write-down. Lower receivables can reflect collections, write-offs, acquisition effects, or currency translation.
Balance-sheet differences therefore do not always equal operating cash movements. Read the cash flow statement and notes before calling a reduction a cash release. A negative working capital balance also needs business context; it is not automatically bad.
Compare several like-for-like annual or trailing-twelve-month periods and consider seasonality. A seasonal year-end balance can mislead even when the arithmetic is correct. SML’s TTM free cash flow walkthrough helps keep reporting periods consistent.
Compare the cash flow yield inputs
For the calculator exercises, value the fictional business at the end of Year 2. Assume all excess cash from earlier years was distributed before valuation, cash and non-operating assets are zero, debt is zero, and diluted shares are 100. A fictional comparison price of $9 per share gives market capitalization of 900.
In the FCF Yield Calculator, select USD and Enter market capitalization. Set Revenue to 1,000 and Market capitalization to 900. Compare these Annual free cash flow inputs:
| Cash flow basis | Annual free cash flow | FCF yield | Price to FCF (times) |
|---|---|---|---|
| Year 2 including the release | 120 | 13.3% | 7.5× |
| Conditional flat-sales scenario | 90 | 10.0% | 10.0× |
The numerator equals equity cash flow only under this example’s stated assumptions. The denominator is equity market capitalization, not enterprise value, and is unchanged between cases. The higher historical yield reflects the release, not stronger profit or a promised investment return.
Carry the assumption into a valuation scenario
Use the DCF Calculator with USD selected and these fictional inputs. WACC is the discount rate used for FCFF here; terminal growth governs cash flow after the explicit forecast. The first forecast cash flow arrives one year after the end-of-Year-2 valuation date.
The Current annual FCFF entry below is a normalized starting assumption of 90, not Year 2’s historical 120. Removing the release alone does not establish sustainable FCFF; profit, taxes, capital spending, and future working capital still need support.
| Calculator field | Input |
|---|---|
| Current annual FCFF | 90 |
| Annual FCFF growth | 0% |
| Forecast years | 5 |
| WACC | 10% |
| Terminal growth | 0% |
| Cash and non-operating assets | 0 |
| Debt and debt-like claims | 0 |
| Diluted shares outstanding | Enter 100 (million shares) |
| Current share price | Leave blank |
At zero growth, annual year-end cash flow remains 90. The five explicit forecast years are followed by a zero-growth perpetuity. Enterprise value is therefore 90 ÷ 10% = 900, equity value is 900, and value per share is $9; this is not the value of five years alone. Mechanically starting at 120 instead gives enterprise value of 1,200 and $12 per share, 33.3% higher. That second calculation carries the historical release into every future year.
These fixed inputs are a calculator scenario, not a complete forecast of asset replacement or returns on reinvestment. In particular, holding capex at 30 and depreciation at 20 does not prove that annual FCFF of 90 can be sustained indefinitely.
Removing a release from recurring cash flow does not make the cash fictitious. If previously released cash remains at valuation and qualifies as excess cash, include it once in the cash bridge from enterprise to equity value. Do not repeat it in annual cash flows and also add it as cash.
In the Reverse DCF Calculator, set Current share price to $9 and retain the normalized 90 FCFF, 100 shares, zero cash and debt, five years, 10% WACC, and zero terminal growth. The implied annual FCFF growth is 0%. The historical 71.4% FCF increase does not justify forecasting 71.4% annual growth.
A constant-growth calculator cannot separately time an isolated future working capital release. That requires a detailed forecast. These outputs demonstrate scenario mechanics, not forecasts or price targets.
Before using a strong cash flow year
- Identify the cash flow definition and match periods and units.
- Reconcile working capital movements to the cash flow statement and notes.
- Separate a sustainable balance from a repeatable annual change.
- Forecast reinvestment needs and keep historical and normalized cases visible.
- Count retained excess cash once, at the valuation date.
For broader adjustments, continue with how to analyze free cash flow.
Educational use only. This lesson is not investment advice or a recommendation to buy or sell any security.