
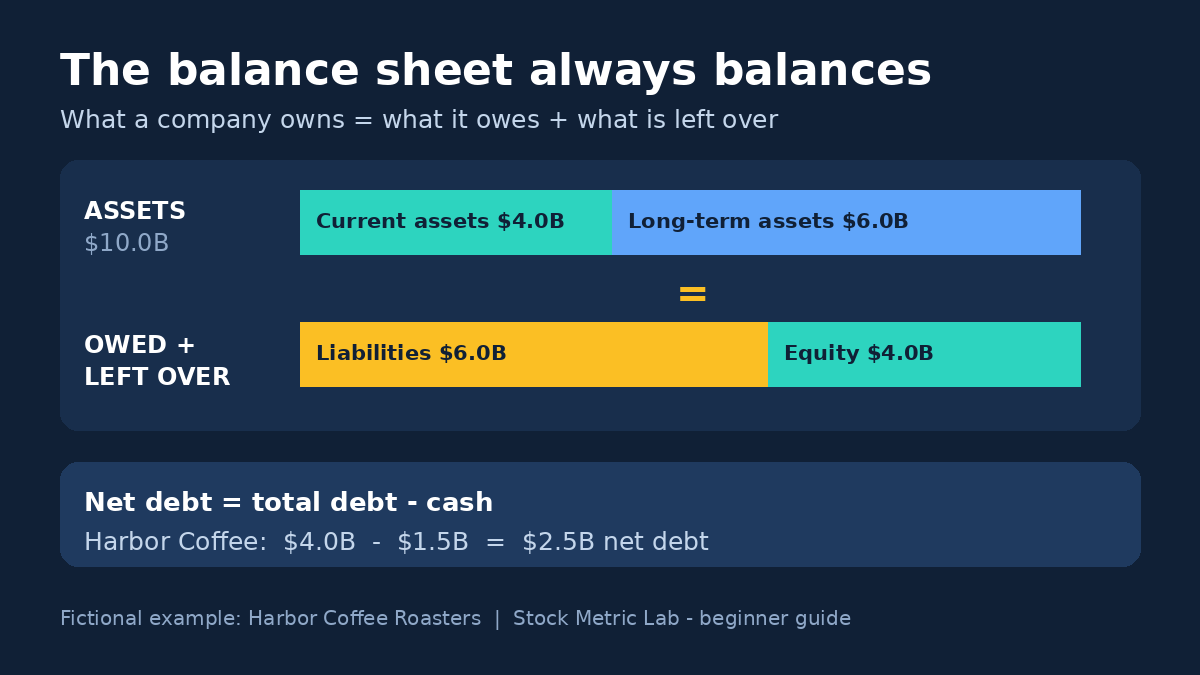
If the income statement is a movie — a company earning and spending over three months — the balance sheet is a photograph. It freezes one single day and answers three plain questions: what does this company own, what does it owe, and what is left over for the shareholders once all the liabilities are paid?
That photograph matters more than beginners expect. Earnings can be flattered by one good quarter. The snapshot complements earnings, but it is not immune to estimates, errors or manipulation. Check the accounting policies, asset quality, cash restrictions and debt-maturity notes alongside the income and cash flow statements. Cash on a balance sheet is not proof by itself: according to the SEC complaint, the Satyam case involved more than $1 billion in fictitious cash and cash-related balances — about half the company’s total assets — created with false invoices and forged bank statements (SEC Litigation Release No. 21915, April 5, 2011). This guide walks through a complete balance sheet with a fictional company, shows the one subtraction that separates net cash from net debt, and ends with the famous test Benjamin Graham built on exactly this statement.
New to financial statements in general? Our overview of the three financial statements shows where the balance sheet fits; this page is the deep dive on the statement itself.
The short answer
Every balance sheet obeys one equation:
Assets = Liabilities + Shareholders’ equity
- Assets — everything the company owns or controls: cash, inventory, factories, money customers owe it.
- Liabilities — everything it owes: supplier bills, bank loans, bonds, taxes due.
- Shareholders’ equity — the leftover: assets minus all liabilities. If every asset were sold at its stated value and every liability paid, this is what would remain for shareholders. It is also called book value.
The two sides always balance — that is where the name comes from. If they ever did not, the books would be wrong by definition.
A complete balance sheet, line by line
Meet Harbor Coffee Roasters, a fictional company with 400 million shares outstanding. Here is its balance sheet, in billions of dollars:
| Assets | $bn | Liabilities and equity | $bn |
|---|---|---|---|
| Cash and equivalents | 1.5 | Accounts payable (supplier bills) | 1.0 |
| Accounts receivable (customers owe Harbor) | 1.0 | Short-term debt | 0.5 |
| Inventory (beans, cups, packaged coffee) | 1.5 | Other current liabilities | 1.0 |
| Total current assets | 4.0 | Total current liabilities | 2.5 |
| Property and equipment (roasteries, stores) | 5.0 | Long-term debt | 3.5 |
| Other long-term assets | 1.0 | Total liabilities | 6.0 |
| Shareholders’ equity (book value) | 4.0 | ||
| Total assets | 10.0 | Total liabilities + equity | 10.0 |
Read it in three passes:
- Current is a classification, not a guarantee. Current means the item is expected to be settled within the company’s operating cycle or one year, as applicable — not that it will certainly turn into cash at its book value. Prepaid expenses are consumed rather than converted to cash, and receivables and inventory may not be collected at the amounts shown. Current liabilities come due within the operating cycle or one year, as applicable, and payment deadlines are not limited to borrowings: supplier bills, taxes and leases carry due dates too.
- The debt lines have deadlines — and so does everything else in current liabilities. Harbor owes $0.5 billion of borrowings soon and $3.5 billion later. Borrowed money is only one of the claims that can force a crisis; a supplier, a tax authority or a lessor can demand payment on its own schedule.
- Equity is a residual, not a bank account. Harbor’s $4.0 billion of book value works out to $10.00 per share ($4.0bn ÷ 400 million shares). It is an accounting leftover built up from the capital shareholders put in plus every year of retained profit — not cash sitting somewhere, not what the shares are worth on the market, and not what shareholders would actually receive in a liquidation. Stated values may not be realized, and senior claims are paid before common shareholders.
One more habit worth building now: equity is not guaranteed to grow. Heavy share buybacks are recorded against equity, so a profitable company can show a shrinking — occasionally even negative — book value simply because it has returned so much cash to shareholders. A falling equity line is a question to investigate, not an automatic alarm.
Net cash and net debt: the subtraction that changes the price tag
The single most useful thing a beginner can pull from a balance sheet is this:
Net debt = total debt − cash and equivalents
- Harbor: $4.0bn of debt (0.5 short-term + 3.5 long-term) − $1.5bn of cash = $2.5bn of net debt.
- Summit Software, a second fictional company, holds $6.0bn of cash against $2.0bn of debt: $2.0bn − $6.0bn = −$4.0bn of net debt — better known as $4.0bn of net cash.
In these fictional examples, net debt means short- and long-term borrowings less cash and cash equivalents. We assume that cash is available and omit other debt-like claims. Assume market capitalizations of $12.0 billion for Harbor and $30.0 billion for Summit. Then the simplified EV calculations are $12.0bn + $2.5bn = $14.5bn and $30.0bn − $4.0bn = $26.0bn. These are valuation calculations using the simplified formula EV = market cap + net debt, not quoted takeover prices or cash refunds. Actual transactions can involve a control premium, fees, working-capital adjustments and different treatment of debt and cash. Restricted cash and cash needed to operate the business may not be available to offset debt.
Why it matters: the market cap prices only the equity. Enterprise value adds net debt to market cap to value the operating business to all capital providers — but the simplified calculation above is only a starting point. Our enterprise-value guide explains the adjustments a real calculation needs: preferred stock, non-controlling interests, leases, pensions, and cash that is restricted or needed to run the business.
The same subtraction feeds the leverage checks used across our company analyses, such as net debt to EBITDA. Net debt to EBITDA is a leverage screening ratio, not a forecast of how many years repayment will take. EBITDA does not deduct every cash need, including capital expenditure, tax and interest; actual repayment depends on cash generation, restrictions and maturities.
Two quick health checks
1. The current ratio. Current assets ÷ current liabilities. Harbor: $4.0bn ÷ $2.5bn = 1.6. That means $1.60 of book-value current assets for each $1 of current liabilities — a balance-sheet comparison, not a promise that the year’s cash inflows will cover the year’s payments. Treat the level loosely — a supermarket chain can run safely below 1.0 because it sells inventory for cash before paying suppliers, while a manufacturer may need a bigger cushion. The trend and the comparison with direct competitors tell you more than any single threshold.
2. Working capital. Current assets − current liabilities. Harbor: $4.0bn − $2.5bn = +$1.5bn. Negative working capital is a question, not a verdict: some business models are built to run that way, and for others it can signal strain. The composition of the current lines and the cash flow statement tell you which it is.
Neither check replaces reading the debt schedule — when the long-term debt actually comes due — but together they are a thirty-second starting point. Before drawing a conclusion, check asset quality, seasonality, cash flow, undrawn credit facilities and maturities.
Graham’s net-net test: the balance sheet at maximum strictness
Benjamin Graham’s net-net test uses the balance sheet at maximum strictness. The idea, in our own words, is to value a company from its current assets alone: take current assets, subtract all liabilities, and what is left is the net current asset value. One refinement when the question is what belongs to the common shareholders: priority claims that are not part of total liabilities — preferred stock carried in equity, or in the in-between category some balance sheets use, for example — must be deducted as well, while a claim already counted inside total liabilities must not be subtracted a second time. The resulting company-wide amount is then compared with the total market value of all the common shares — a company amount against a company amount, not against a per-share price.
Run Harbor through the calculation: $4.0bn of current assets − $6.0bn of total liabilities = −$2.0bn. (Harbor has no preferred stock or other priority claims beyond its liabilities, so nothing further comes off.) Harbor has no net current asset value at all, because its current assets alone do not cover everything it owes — which is itself the lesson. What survives from his method is not the formula but the discipline: start with what the company owns and owes, at stated values, before you pay anything for its story about the future.
One caution the calculation itself carries: net current asset value is a book-value figure, not a guarantee of what a liquidation would return. Current assets may realize below their stated values, and the factories, the brand and all future earnings are deliberately left out of the calculation — the test only asks what the current assets alone are worth after every liability is paid.
What the balance sheet cannot tell you
- It records stated values, not market values. A factory bought decades ago sits on the books at its depreciated cost; land can be worth far more than its line suggests, and a struggling retail chain’s inventory far less.
- It leaves out much of the value a company built itself — and it does not label every acquired intangible as goodwill. Many internally built brands and customer relationships are absent from the balance sheet. In a business combination, identifiable acquired intangible assets can be recognized separately from goodwill. Goodwill is the residual acquisition amount, not a label for every intangible asset. Recognition rules differ by asset and accounting framework, so book value is not a complete measure of business value. Microsoft’s 2024 annual report (Note 8) shows the distinction in practice: in the Activision Blizzard purchase, $22.0 billion of intangible assets — marketing-related, technology-based and customer-related — were recognized separately from $51.0 billion of goodwill.
- It is one day, not a trend. A balance sheet dated December 31 can look very different from the same company’s March 31 sheet — retailers, for instance, stock up before the holidays and collect after. Compare the same quarter across years, and read several periods in a row.
Where to find it
Look in the financial statements section of a 10-K or 10-Q for a balance sheet dated ‘as of’ the reporting date and comparative balances. Presentation and number of comparative columns can differ. Note the words “as of” in its title — a balance sheet always carries a date, never a period. The companion statement that explains how the cash line moved between the two dates is the cash flow statement, covered in our guide to free cash flow.
How a beginner should actually use a balance sheet
- Do the subtraction first. Total debt minus cash: net debt or net cash? It takes ten seconds and reframes every headline number that follows.
- Check the scheduling — then go beyond the ratios. Current ratio and working capital, then the split between short-term and long-term debt. Then read the debt-maturity notes, the cash flow statement, and what credit facilities the company has. The ratios are the entry point, not the conclusion.
- Watch equity’s direction — and ask why. Growing equity from retained profits is the normal engine of book value. Shrinking equity at a profitable company usually means buybacks or dividends; shrinking equity at a losing company means the losses are consuming the cushion.
- Compare like with like. Same company across years, and direct competitors in the same industry. A balance sheet read alone is a photograph; a row of them is the closest thing accounting gives you to a film of a company’s financial strength.
Our step-by-step framework for how to analyze a stock shows where this balance-sheet pass sits inside a full analysis, alongside the income statement and cash flow checks in the three financial statements.
Key takeaways
- A balance sheet is a snapshot at one date: assets = liabilities + equity, always.
- Equity (book value) is the accounting leftover for shareholders — assets minus all liabilities — not cash, not market value, and not a liquidation payout.
- Net debt = total debt − cash (in our fictional examples). A negative answer is net cash. Net debt is debt less the qualifying cash defined for the calculation; it is a starting point for leverage and enterprise-value analysis.
- The simplified EV in our examples (Harbor $14.5bn, Summit $26.0bn) is a valuation calculation, not a takeover price or a cash refund.
- Net debt to EBITDA is a leverage screening ratio, not a repayment forecast — EBITDA leaves out capital expenditure, tax and interest.
- Current ratio and working capital are thirty-second starting points; check asset quality, seasonality, cash flow, credit facilities and maturities before judging safety.
- Graham’s net-net test — current assets minus all liabilities, compared company-wide with the total market value of the common shares — is the balance sheet used at maximum strictness: own and owe first, story second. It is a book-value test, not a guaranteed liquidation recovery; priority claims outside total liabilities are deducted as well, and claims already included in liabilities are not deducted twice.