
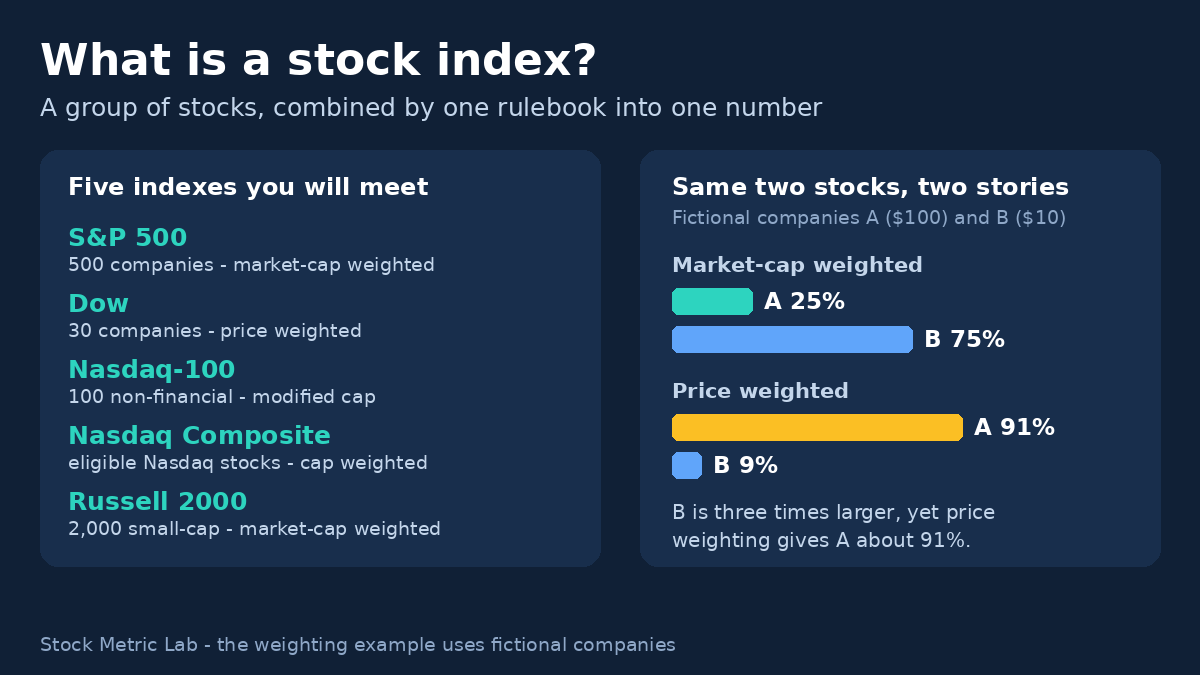
Every evening the news says some version of the same sentence: “The market rose today.” Nobody bought or sold “the market.” What rose was an index — a single number that summarises the prices of a group of stocks at once.
If you are new to investing, the index is the first piece of market language worth learning properly, because almost everything else is measured against it. This guide explains what an index is, how the famous ones are built, and how to read them without being misled.
New to shares themselves? Start with what a stock is and come back — this page assumes you know that much and nothing more.
The short answer
A stock index is a defined basket of stocks, maintained under a published set of rules and combined into one number. When the number rises, the stocks on the list, taken together, rose. When it falls, they fell.
Three consequences follow, and each one surprises beginners:
- An index is a basket plus a rulebook, not a thing you can buy. A company called an index provider writes the rules and calculates the number.
- The rules decide what the number means. Two indexes covering the same country can move differently on the same day because their lists and weighting rules differ.
- The level itself is arbitrary. Only the percentage change carries information. A point is not a dollar, or a percent.
Who makes indexes, and what is in them?
Indexes are maintained by specialist providers. The names behind the benchmarks in this guide:
- S&P Dow Jones Indices — the S&P 500 and the Dow Jones Industrial Average
- Nasdaq — the Nasdaq-100 and the Nasdaq Composite
- FTSE Russell (part of LSEG) — the Russell 2000
Each provider publishes a methodology: which stocks are eligible, how many are included, and how each one counts. Members are reviewed on a schedule and replaced when they no longer fit the rules — an index is a maintained list, not a museum. Being added to or removed from a major index is real news for a company, because funds that track the index may adjust their holdings, whether through full replication or sampling.
How the number is built: weighting
Adding up a group of share prices is not as simple as it sounds, because a $500 share and a $5 share cannot just be averaged. Indexes solve this with weighting — a rule for how much each stock counts. There are three main schemes.
Market-cap weighting (the modern standard). Each stock counts in proportion to its total market value: share price × shares outstanding. In practice, the S&P 500 and the Russell 2000 use a narrower version of that total — share price × the shares available to the public (the “free float”) — known as float-adjusted market capitalisation. Which shares count as free float is set by each provider’s rules; holdings by insiders, governments and other strategic holders are the typical exclusions under those rules. Either way, a company worth ten times as much moves the index roughly ten times as much, when both shares move by the same percentage.
Price weighting (the older scheme). Each stock counts in proportion to its share price alone, whatever the company’s size. The Dow works this way — it is the famous survivor of the older scheme.
Equal weighting. Every stock has the same target weight at rebalancing; the weights drift as prices move between rebalances. It exists (there is an equal-weight version of the S&P 500), but it is the exception, not the headline.
A two-stock example
Imagine an index with two fictional companies. The example uses shares available to the public, as a float-adjusted index would:
| Share price | Shares available | Market value | |
|---|---|---|---|
| Company A | $100 | 10 million | $1.0 billion |
| Company B | $10 | 300 million | $3.0 billion |
Company B is three times larger. Now watch what each weighting scheme does with them:
- Market-cap weighted: A is 25% of the index, B is 75%.
- Price weighted: A is about 91% of the index ($100 of the $110 combined price), B about 9%.
Suppose A’s shares rise 10% and B’s do not move. The market-cap index rises 2.5% (25% × 10%). The price-weighted index rises about 9.1% — driven almost entirely by the smaller company, simply because its share price has more digits.
Neither answer is “wrong.” They are answers to different questions. But it is why a price-weighted index can be pushed around by one expensive share, and why a market-cap index is, by construction, a story about its largest members.
One mechanical detail keeps all of this honest: providers use an adjusted number called a divisor to keep the index continuous when something artificial happens. In a price-weighted index, the divisor is adjusted for corporate actions such as splits and for membership changes; in a market-cap-weighted index, the share counts and free float — and the divisor where needed — are adjusted for corporate actions and membership changes. Either way, the adjustments are there to keep the index continuous through specified corporate actions: a split changes a company’s share price, not its value, and the divisor and share-count adjustments are designed so that the action itself does not move the index level.
The indexes you will actually meet
| Index | Provider | Members | Weighting | What it represents |
|---|---|---|---|---|
| S&P 500 | S&P Dow Jones Indices | 500 leading U.S. companies | Float-adjusted market cap | Large U.S. companies; about 80% of the available U.S. market value |
| Dow Jones Industrial Average | S&P Dow Jones Indices | 30 large, well-known U.S. companies | Price | A short, famous shortlist — history more than breadth |
| Nasdaq-100 | Nasdaq | 100 of the largest eligible Nasdaq-listed non-financial companies | Modified market cap (with caps) | Large growth and technology companies; no banks or insurers |
| Nasdaq Composite | Nasdaq | Eligible Nasdaq-listed stocks (thousands) | Market cap | The whole Nasdaq market, not a shortlist |
| Russell 2000 | FTSE Russell | About 2,000 smaller-cap U.S. companies within the Russell 3000 | Float-adjusted market cap | The standard small-company benchmark |
A few notes the table cannot hold:
- The S&P 500 holds 500 companies, but slightly more than 500 share lines, because a few companies have two classes of shares in the index. S&P Dow Jones Indices describes it as the best single gauge of large-cap U.S. equities, and its members are selected by a committee working to published rules. Share counts and free float are maintained each quarter, while constituent changes are made when needed under the published rules. S&P Dow Jones Indices’ factsheet puts its coverage at about 80% of available U.S. market value.
- The Nasdaq-100 is not “the Nasdaq.” The Nasdaq Composite covers eligible Nasdaq-listed stocks — thousands of companies. The Nasdaq-100 is the selective top slice, and its “modified” weighting caps how far any single giant can dominate. Its membership is reviewed every December, with rank-based quarterly reviews in March, June and September, and a Fast Entry path for very large new listings (Nasdaq-100 methodology, as updated May 1, 2026): a newly listed company that ranks among the top 40 can become eligible for addition after its seventh trading day — that day is when eligibility can start, not a guaranteed inclusion date. The index is designed to represent 100 of the largest eligible Nasdaq-listed non-financial companies.
- The Dow is the odd one out. It is the only price-weighted index in this table, so a company with a very high share price can outweigh a far larger company — the two-stock example above is the Dow’s logic in miniature. Its 30 members are chosen by a committee, like the S&P 500’s.
- Membership in the Russell 2000 follows published rules rather than discretionary stock selection. U.S. companies are ranked by size, and eligibility conditions and banding keep borderline companies from flipping in and out at every rebuild. The smaller companies in the Russell 3000 form the index — approximately 2,000 of them. The list is reconstituted twice a year (June and December, from 2026), so it stays a genuine small-company list even as members grow out of it.
- The headline versions of the indexes here are price-return versions. That matters more than it sounds — see the dividends note below.
If you follow Japanese stocks
Our Japanese company coverage uses two benchmarks you will see in Tokyo headlines: the Nikkei 225 (225 large companies, price-weighted like the Dow, but with each price first adjusted by a Price Adjustment Factor, calculated by Nikkei Inc.) and TOPIX (the broad Tokyo market, free-float-adjusted market-cap weighted, run by the JPX group). The same ideas in this guide — weighting, continuity adjustments, points versus percentages — apply to them, each with its own provider mechanics.
Points are not percentages
Index levels started at arbitrary values on long-past base dates and have been divided and adjusted ever since. That is why:
- “The Dow fell 500 points” and “the S&P 500 fell 50 points” are not comparable statements. Convert to percentages first.
- You cannot compare levels across indexes. A higher level does not mean a “stronger” market.
- A 1% move is arithmetically comparable across indexes, but it is not the same risk, currency or mix of companies. Compare moves over the same period, in the same currency and on the same return basis (price or total return). Percentage changes are the useful starting point for comparison, subject to those differences.
When an index does fall hard, the recovery maths is its own trap — a 30% fall needs a gain of about 43% just to get back to even. We work through that in drawdown and recovery math.
The dividend gap: price return vs total return
The index levels quoted in the news are the commonly quoted price-return versions, and they leave dividends out. The S&P 500 level, for instance, tracks prices only. Providers also publish total return versions that add dividends back in as reinvested; when that reinvestment is assumed to happen follows each provider’s own rules.
Even over short periods the difference can show up, because dividends are paid on specific dates. Over twenty years it is large, because dividends compound. So when you compare an index’s record with anything else — a fund, your own portfolio — make sure both sides are measured on the same basis: price return against price return, and total return (gross or net of dividend tax) against total return, after fees and in the same currency. Comparing a fund’s total return against a price-only index quietly rigs the race. We work through honest comparison bases in relative performance for long-term investors.
You cannot buy an index — and that is where funds come in
An index is information, not a product. What you can buy is a fund built to track it: an index fund — which may be a mutual fund or an ETF — that holds the same stocks in the same proportions, or a sample of them. Not every ETF tracks an index. A fund that does track an index will not reproduce it exactly: fees, trading costs, sampling and other implementation effects can create tracking differences, and a fund’s returns need not match the index.
This is the route most beginners actually take into the market, and it is why understanding the index matters before choosing the fund: the fund is only ever as diversified, or as concentrated, as the list it copies. We compare the vehicles themselves in stocks, mutual funds and ETFs.
How a beginner should actually use an index
- Read the news in percentages, and know which index is being quoted. In U.S. headlines “the market” usually means the S&P 500. The Dow is quoted just as often because it is famous — but its 30 price-weighted stocks make it the one with the fewest companies in this table, so the same day can produce three different “market” numbers.
- Use it as your yardstick. The honest question for any portfolio or any single stock is not “did it go up?” but “did it beat the index it should be compared with, over years, after fees?” That comparison is a standing step in how to analyze a stock.
- Respect the concentration inside cap weighting. Because the biggest companies dominate, the ten largest constituents accounted for 37.6% of the S&P 500’s weight as of July 31, 2026 (S&P Dow Jones Indices factsheet, Index Characteristics table). The factsheet counts constituents — share lines — and Alphabet appears twice, with its Class A and Class C shares, so those ten constituents are nine companies. An S&P 500 fund is diversified across 500 names and, at the same time, heavily exposed to a handful of giants. Both things are true; investment risk and diversification explains how to think about that.
- Do not trade the daily number. An index is a measuring instrument. Its daily wiggle tells you what the market did, not what you should do.
Watch the indexes yourself
On a chart, indexes have ticker symbols, but the symbol depends on the data provider — treat these as examples and check the provider, currency and series before using one: SPX for the S&P 500, DJI for the Dow, NDX for the Nasdaq-100, COMP for the Nasdaq Composite and RUT for the Russell 2000. Pull one up next to a stock you own and the relationship between “the market” and “my company” becomes concrete in a way no definition achieves. Our guide to reading a stock chart covers the basics, and the TradingView beginner guide shows how to set up a watchlist of indexes alongside your holdings.
Key takeaways
- An index is a basket of stocks plus a rulebook, calculated as one number by a provider.
- Weighting is the rule that matters most: market-cap weighting follows company size; price weighting follows the share price alone.
- The S&P 500 (500 large U.S. companies, cap-weighted) and the Russell 2000 (about 2,000 small ones) cover the U.S. market by size; the Nasdaq-100 tilts toward large non-financial growth companies; the Dow is a short, price-weighted list of 30.
- Points are not percentages, and levels cannot be compared across indexes.
- Headline indexes exclude dividends; comparisons need the same return basis on both sides.
- You invest through index funds and ETFs, which track an index for a small fee — so read the index’s rules before you buy the fund.
Educational material, not investment advice. Index methodologies change from time to time; the providers’ own documents are the final word on current rules.
Sources and methodology notes
The 37.6% concentration example is historical, dated July 31, 2026, not a current concentration reading. It comes from an archived copy of an S&P Dow Jones Indices factsheet hosted by a third party, not a retrieval from S&P’s own server. The ten constituents in that table are ten share lines representing nine companies. We link to the source for attribution; its pages and artwork are not reproduced here.
- S&P U.S. Indices Methodology
- S&P 500 factsheet dated July 31, 2026 — third-party archive
- S&P Index Mathematics Methodology
- Nasdaq-100 guide
- Nasdaq-100 methodology update, May 1, 2026
- Nasdaq-100 Methodology
- Russell U.S. Indexes Construction and Methodology
- Russell Reconstitution schedule
- SEC Investor.gov: Index Funds
- Nikkei Stock Average FAQ
- JPX: TOPIX